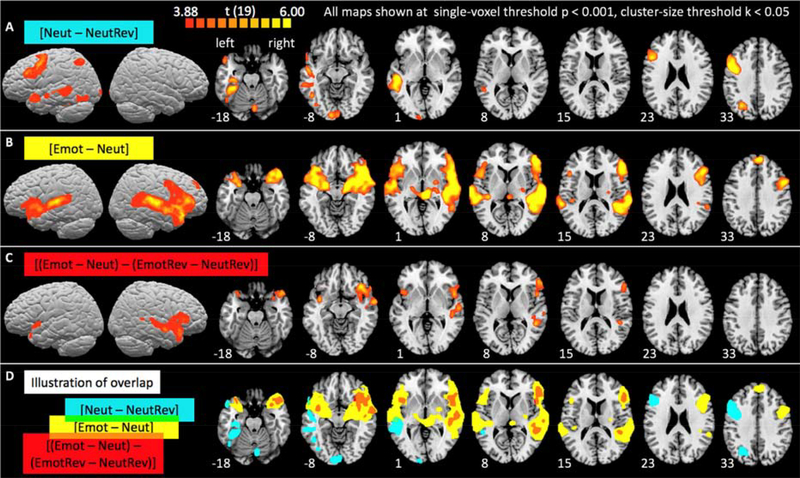
Figure 2.
Whole-brain activation maps for sentence comprehension (A) and for emotional prosody processing including (B) and excluding (C) the influence of acoustic differences between emotional and neutral stimuli. Group-level activations are projected onto the surface and superimposed on horizontal slices of the Colin 25 template brain in Talairach space. Slices were chosen to best show activations and are shown in neurological convention (left hemisphere on the left). Numbers indicate the z-Talairach coordinate of the depicted slices. Detailed information about activation clusters’ locations are provided in Table 2. (D) Overlap of the binarized activation maps from A (blue), B (yellow), and C (red).

