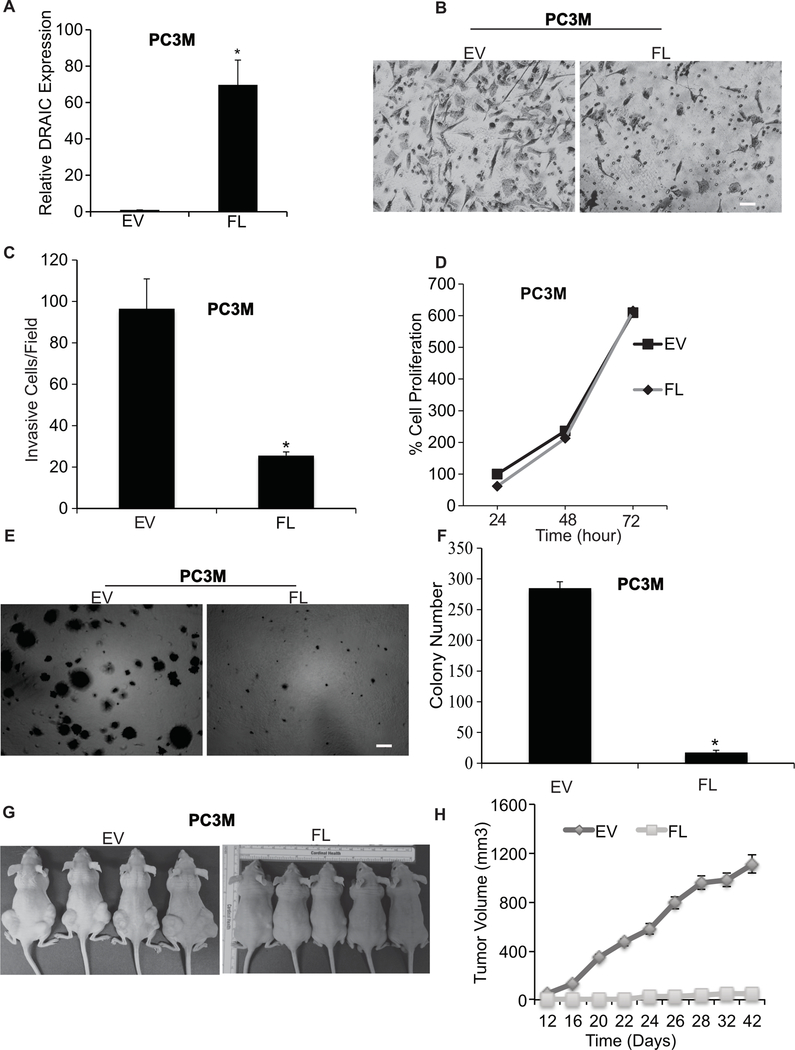
Figure 1. DRAIC suppresses the tumorigenic property of prostate cancer.
(A) RT-qPCR analysis of DRAIC expression with and without overexpression in PC3M cells. We quantified DRAIC expression relative to GAPDH normalized this to the level of DRAIC in empty vector transfected cells. Results expressed as mean ± s.d, n = 3, *P<0.05. (B) Images showing matrigel invasion assay in PC3M cells with empty vector (EV) or overexpressing full length DRAIC (FL). Scale bar 20 μm. (C) The quantification of the invasion assay is done by counting 10 different random fields and plotted average cell number per field. Results expressed as mean ± s.d, n = 3, *P<0.05. (D) Cell proliferation of PC3M cells at indicated hr by MTT assay on cells attached to plastic cell culture dish. Results expressed as mean ± s.d, n = 3, *P<0.05. (E, F) Anchorage independent soft agar colony formation with 104 PC3M cells at 3 weeks. Bar graph represents average and S.D. of colony number per field from 10 fields. Scale bar 50 μm. Results expressed as mean ± s.d, n = 3, *P<0.05. (G) Nude mice (n = 10 per group) were injected with PC3M cells overexpressing EV and FL and Tumor volume is calculated twice in a week and plotted in (H). mean ± s.d, *P<0.05.

