
Figure 1.
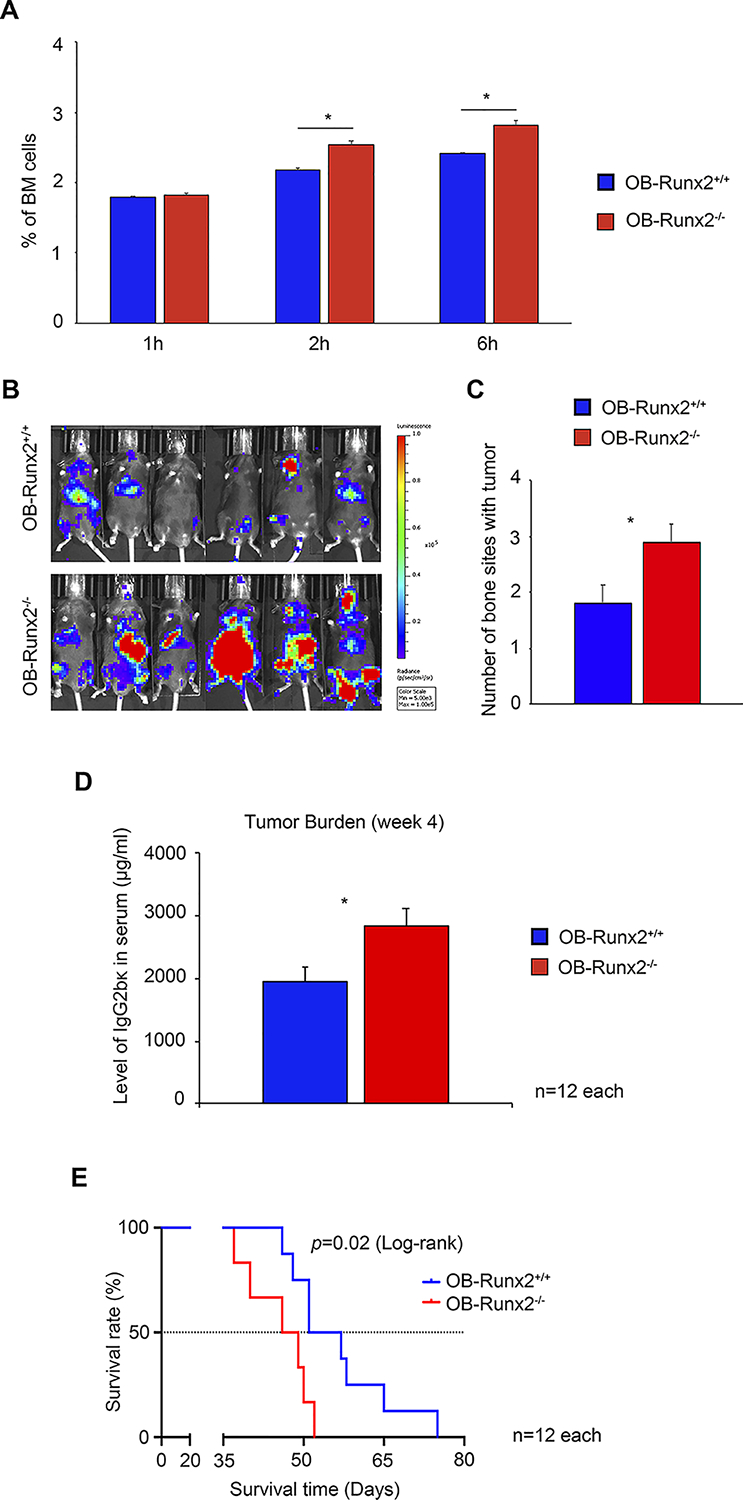
Accelerated bone-homing and growth of 5TGM1 MM cells in the OB-Runx2−/− mouse model. A, To assess bone-homing of MM cells, OB-Runx2+/+ and OB-Runx2−/− mice were i.v. injected with 5TGM1-GFP MM cells (2×10⁶ cells per mouse, n=12 mice/group). BM cells were harvested 1, 2 and 6 hours after tumor cell injection (n=4 mice/group/time point), and GFP+ MM cells were counted by FACS. The percentage of MM cells among all BM cells is shown for each time point. B-E, To assess MM growth and mouse survival rate, OB-Runx2+/+ and OB-Runx2−/− mice were i.v. injected with 5TGM1-Luc MM cells (106 cells per mouse; n=12 mice/group), and tumor growth was analyzed 4 weeks later. Representative bioluminescence imaging of OB-Runx2+/+ (top) and OB-Runx2−/− (bottom) mice (B), the number of bone sites with tumor in each group (C), and the levels of IgG2bκ in the serum of OB-Runx2+/+ and OB-Runx2−/− mice measured by ELISA (in duplicate) (D), Kaplan-Meier survival analysis of OB-Runx2+/+ and OB-Runx2−/− mice after tumor cell injection (E). For A, C, and D, data are presented as mean ± SEM. *P < 0.05 between groups.