
Figure 2.
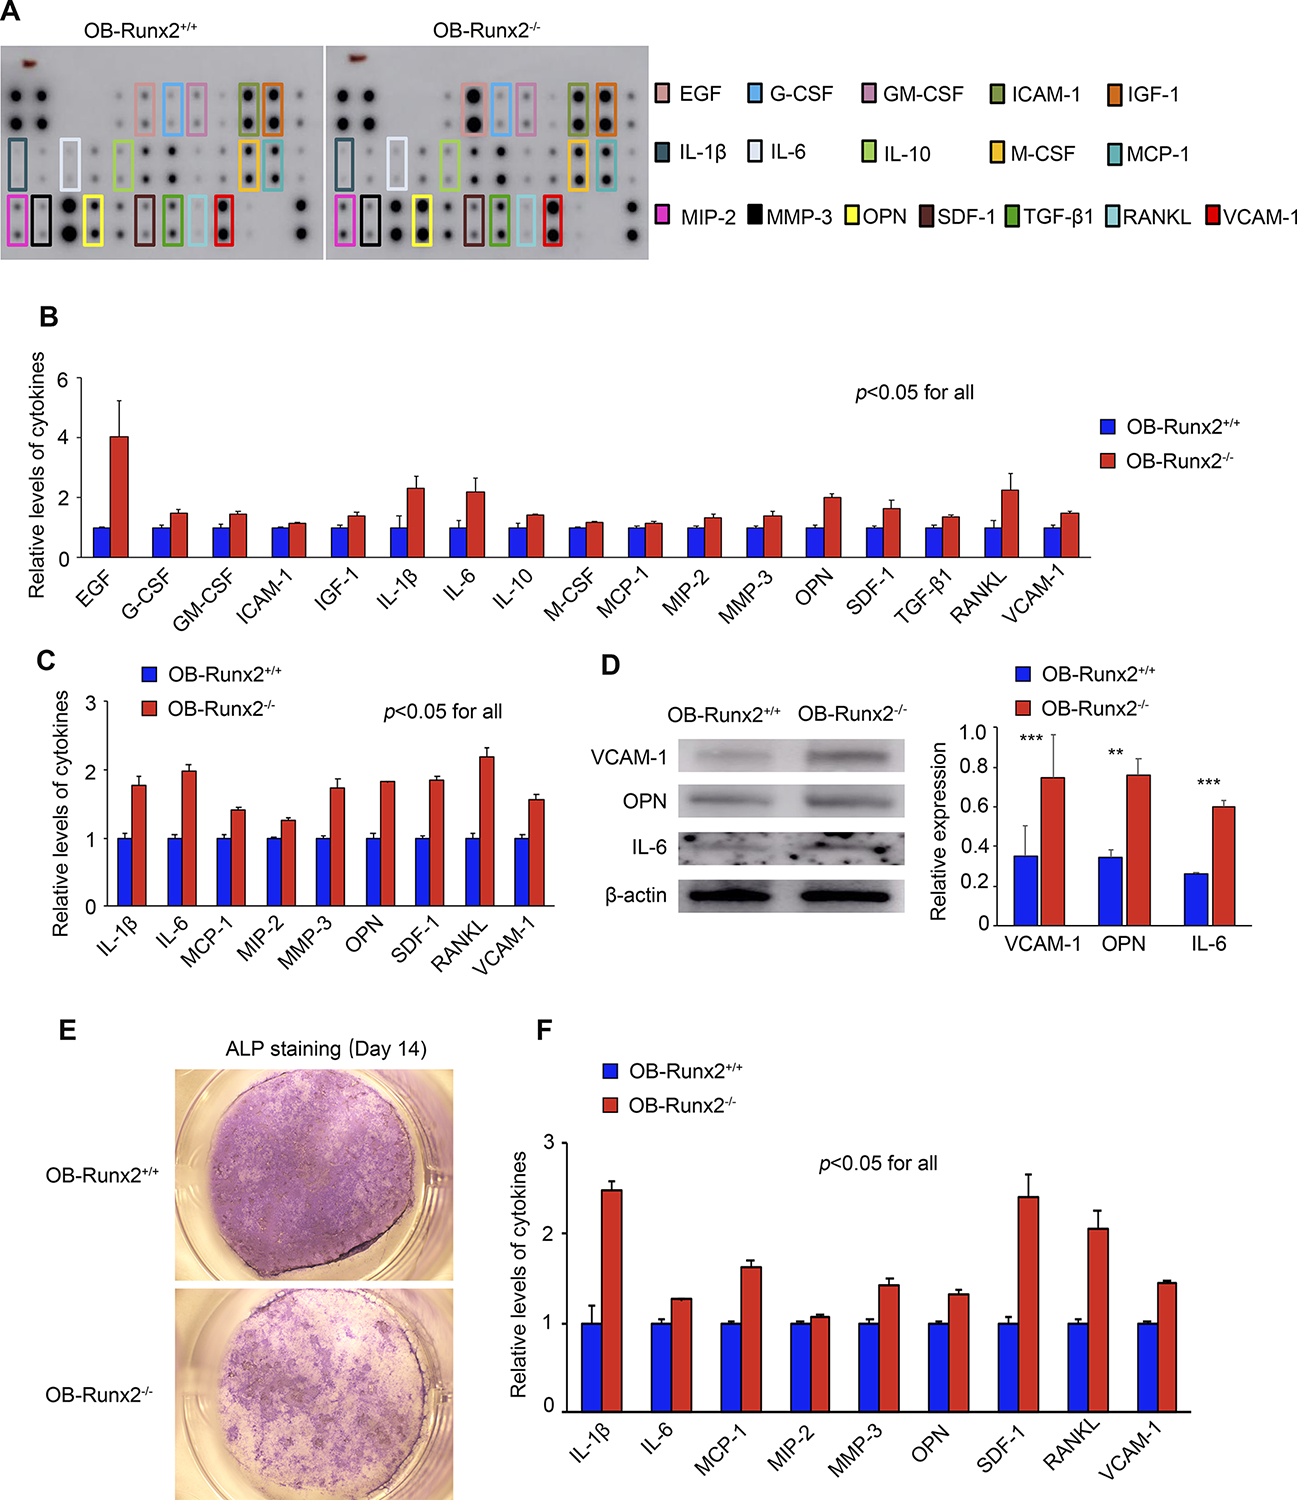
OB-Runx2 deficiency increases levels of protumorigenic and MDSC-stimulating cytokines in BM. A, Representative cytokine array of BM supernatants from OB-Runx2+/+ and OB-Runx2−/− mice before tumor cell injection. Specific cytokines of interest are identified by colored boxes. B, Cytokine levels were quantified by densitometric analysis and normalized to internal controls (n=3 mice/group, in duplicate). C, Cytokine array analysis of CM from Runx2+/+ and Runx2−/− OBs harvested from long bones. Cytokine levels were quantified by densitometric analysis and normalized to internal controls (n=3 mice/group, in duplicate). D, Representative Western blot showing VCAM-1, OPN, IL-6, and β-actin (loading control) expression in Runx2+/+ and Runx2−/− OBs harvested from mouse long bone (left panel). Quantification of VCAM-1, OPN, and IL-6 expression from three independent experiments was performed with Image J software (right panel). E, Primary pre-OBs harvested from the calvaria of newborn OB-Runx2+/+ and OB-Runx2−/− mice were cultured in osteogenic medium, with medium changed every 3 days. Representative images of ALP staining performed at day 14 for identification of differentiated, mature OBs (Leica KL300 LED stereomicroscope, 8X; Leica DFC310 FX digital color camera). F, Cytokine array analysis of CM (day 14) from calvarial OB cultures. Cytokine levels were quantified by densitometric analysis and normalized to internal controls (n=3 mice/group, in duplicate). Data are presented as mean ± SEM. **P < 0.01. ***P < 0.001.