
Figure 7.
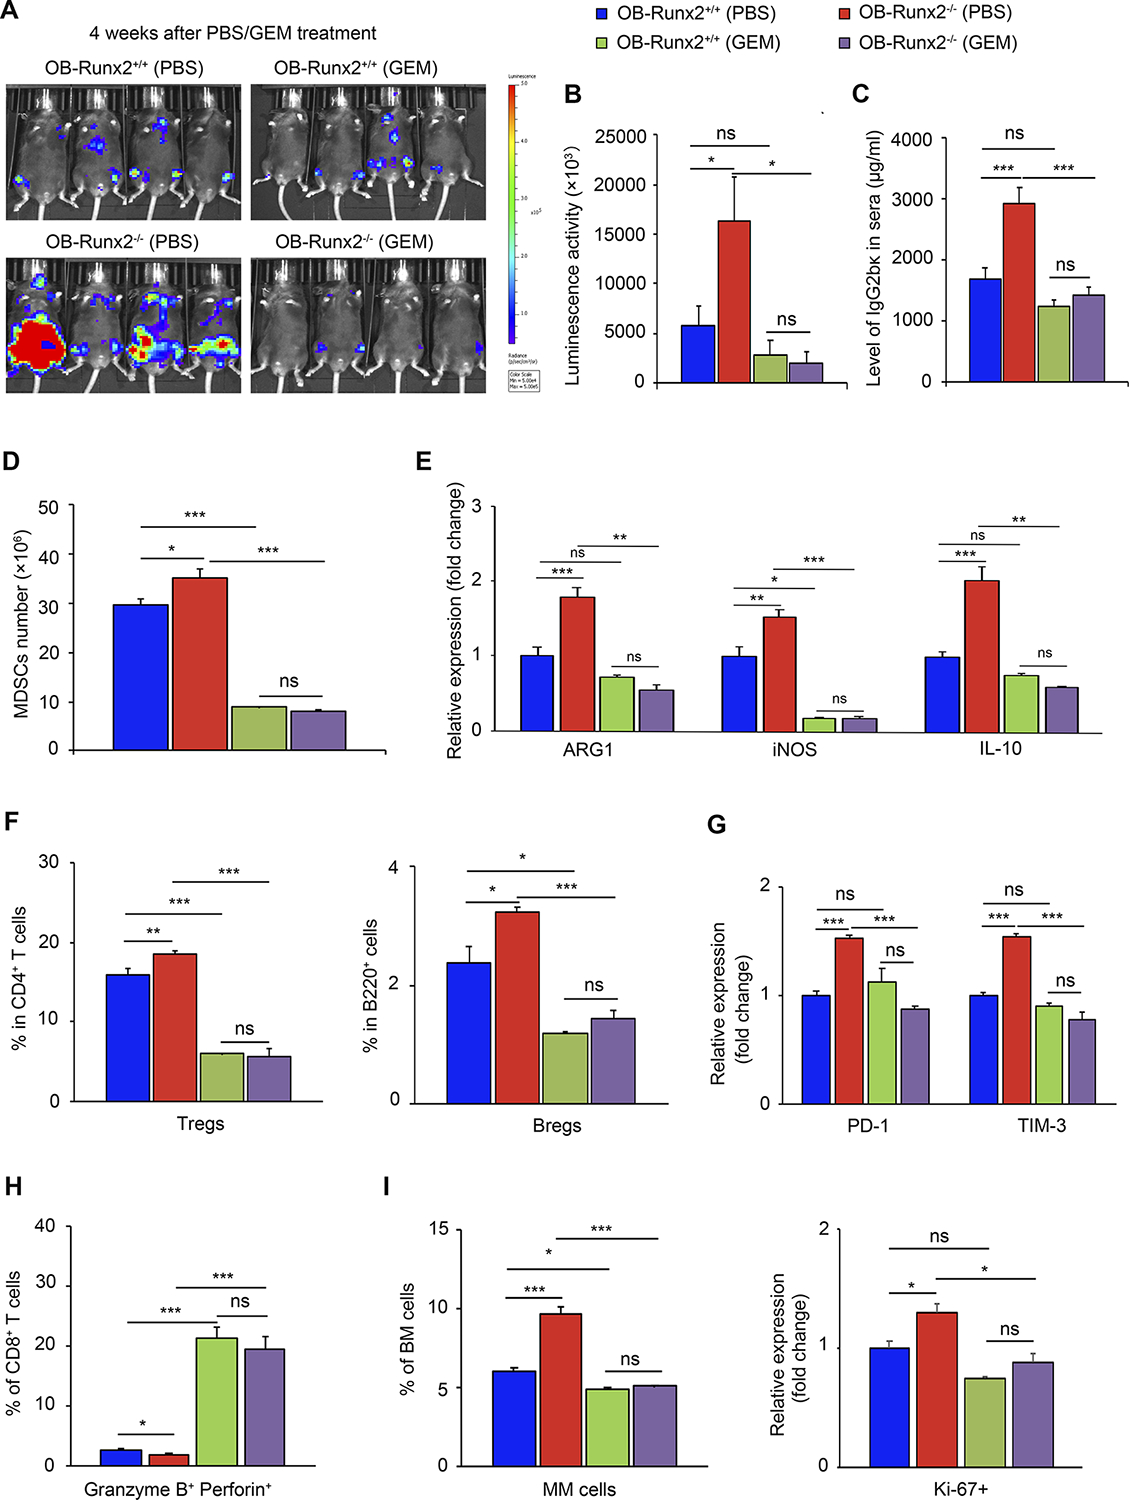
MDSC depletion enhances antitumor immunity and reduces tumor progression in OB-Runx2−/− mice. OB-Runx2+/+ and OB-Runx2−/− mice were i.v. injected with 5TGM1-Luc MM cells (106 per mouse). Five days after tumor cell injection mice began weekly treatment with PBS or GEM (60 mg/kg/week) (n=8 mice/group). A, Representative bioluminescence imaging and B, Mean bioluminescence activity in each group after 4 weeks of PBS or GEM treatment. C, Total tumor burden of each treatment group, measured by serum IgG2bκ ELISA after 4 weeks of PBS or GEM treatment. D-I, FACS analysis of BM cells from tumor-bearing bones after 4 weeks of PBS or GEM treatment. D, Total number of MDSCs (Gr1+ CD11bhi) among BM cells. E, Expression of ARG1, iNOS, and IL-10 in MDSCs of each group relative to that in PBS-treated OB-Runx2+/+ mice, as determined by FACS. F, Percentage of Tregs among CD4+ T cells (left) and of Bregs among B220+ cells (right). G, Expression of PD-1 and TIM-3 in CD8+ T cells of each group relative to that in CD8+ T cells of PBS-treated OB-Runx2+/+ mice, as determined by FACS. H, Percentage of activated (granzyme B+perforin+) cells among CD8+ T cells. I, Percentage of MM cells among BM cells (left) and expression of Ki-67 among all MM cells of each group relative to that in MM cells of PBS-treated OB-Runx2+/+ mice (right). Data are expressed as mean ± SEM. ns, not significant, *P < 0.05 **P < 0.01, ***P < 0.001.