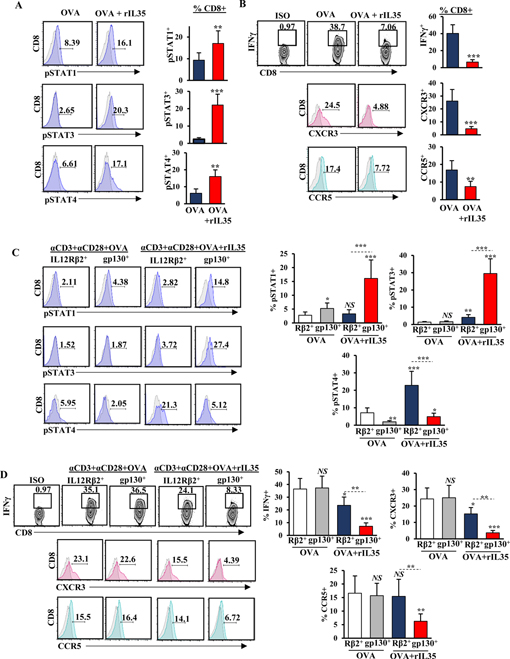
Figure 1. IL35 mediates activation of STAT3, suppression of IFNɣ, and chemotactic receptors CXCR3 and CCR5 in gp130+CD8+ T cells.

(A) Representative flow cytometry histograms (left) and quantification (right) of phospho(p)-STAT1, pSTAT3, and pSTAT4 in CD3+CD8+ T cells, activated with anti-CD3 (1 μg/mL) and anti-CD28 (2 μg/mL) in the presence of OVA (2 μg/mL) with and without recombinant (r)IL35 (50 ng/mL). Proportion of CD8+ T cells is indicated. (B) Representative flow cytometry plots and histograms (left) and quantification (right) of IFNɣ production and expression of CXCR3 and CCR5 in CD3+CD8+ T cells activated as in (A). (C) Representative flow cytometry histograms (left) and quantification (right) of pSTAT1, pSTAT3, and pSTAT in CD3+CD8+ T cells sorted for IL12Rβ2+ or gp130+ subsets (single-positive) activated as indicated in (A). Proportion of CD8+ T cells is shown. (D) Representative flow cytometry plots and histograms (left) and quantification (right) of IFNɣ production and expression of CXCR3 and CCR5 in CD3+CD8+ T cells sorted for IL12Rβ2+ or gp130+ subsets (single-positive) activated as indicated in (A). Proportion of CD8+ T cells is shown. Error bars indicate S.E.M.; p-values were calculated using Student’s t-test (unpaired, two-tailed); NS: not significant, *p<0.05; **p<0.01; ***p<0.001. Experiment were conducted using 6–8–week-old C57B6 mice with 6 mice per group in triplicate. Data represents 3 independent experiments.
