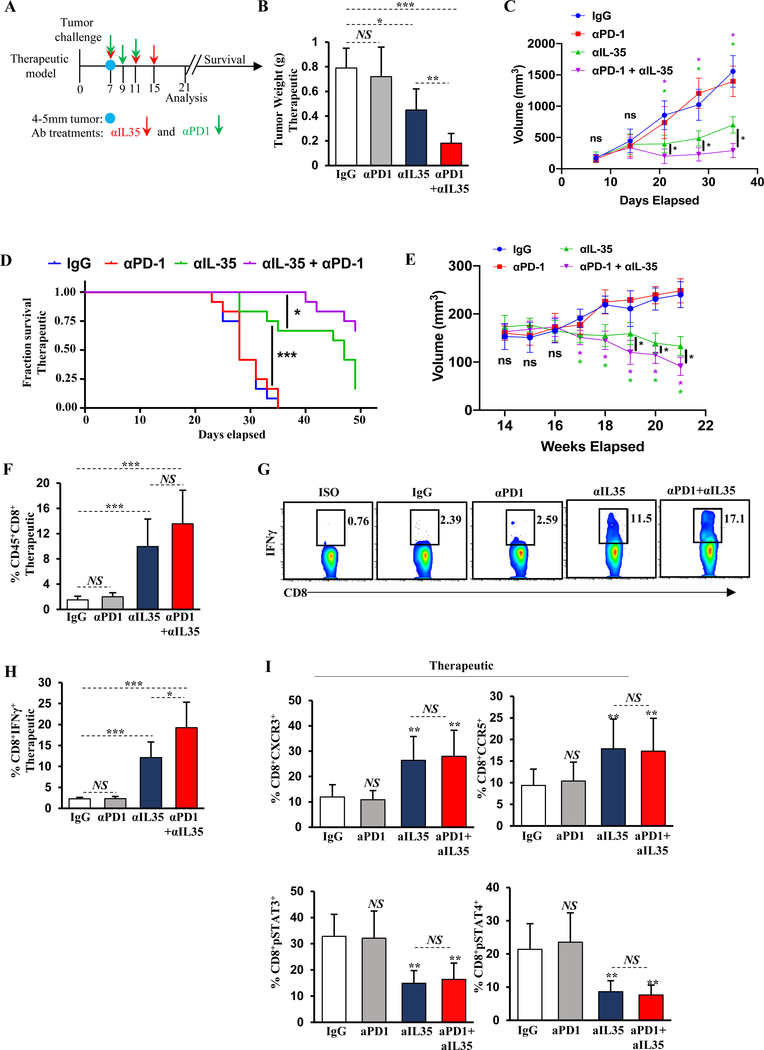
Figure 5. IL35 blockade relieves immunosuppression of CD8+ T cells and synergizes with anti–PD-1.
(A) Schematic of the antibody treatment regimen. Anti-IL35 (200 μg first dose followed by 100 μg per week) or control IgG antibody was administered in therapeutic schedule (1 week after tumor cell injection on days 7, 11, and 15). Administration of anti–PD-1 (200 μg) was initiated on day 7 after tumors reached approximately 4–5 mm in diameter. Two more doses of anti–PD-1 were administered on days 9 and 11. Mice were sacrificed 3 weeks post-tumor cell injection or assessed for survival. (B) Quantification of tumor weight from WT mice treated with therapeutic anti-IL35, anti–PD-1, or combination (as in (A)) 3 weeks post-orthotopic injection with KPC cells (n=6 mice/group). (C) Quantification of tumor growth by ultrasound from WT mice in (B). (D) Survival plot of orthotopically injected WT mice from (B) treated with the indicated therapeutic antibodies. (E) Quantification of tumor growth by ultrasound from spontaneous KPC mice treated with therapeutic anti-IL35, anti–PD-1, or combination as in (A). Treatment was initiated when tumor measuring ~5mm was visualized by ultrasound. (n=6 mice/group). Data represents 3 independent experiments. (F) Quantification of frequency of orthotopic tumor-infiltrating CD45+CD3+CD8+ T cells from mice in (B). (G) Representative flow cytometry plots of intracellular IFNγ in intratumoral CD45+CD3+CD8+ T cells from the mice in (B). Proportion of CD8+ T cells is indicated. (H) Quantification of intratumoral CD8+IFNγ+ T cells from the mice in (B). (I) Quantification of CXCR3, CCR5, pSTAT3, and pSTAT4 expression in intratumoral CD3+CD8+ T cells from mice in (B). Error bars indicate S.E.M.; p-values were calculated using Student’s t-test (unpaired, two-tailed); NS: not significant, **p<0.01; ***p<0.001. Data represents 3 independent experiments.

