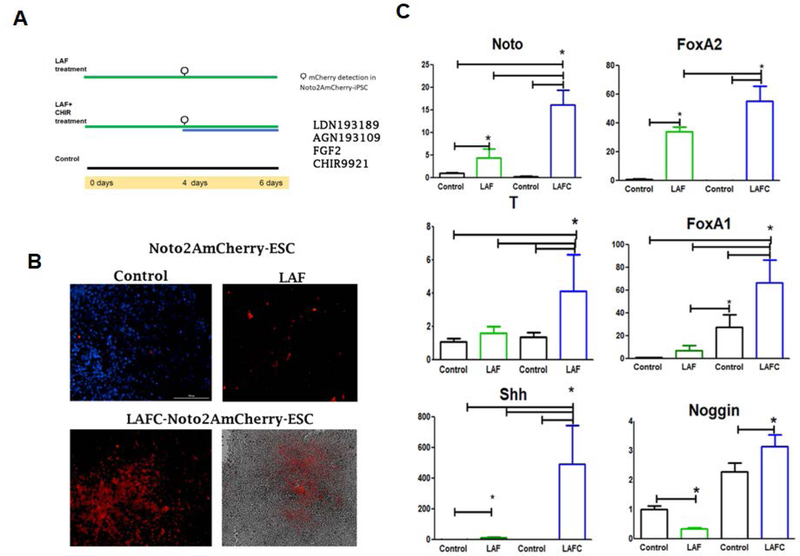
Figure 3: Derivation of two-step differentiation strategy for differentiation of H9-hESCs into notochordal cells:
(A) Schematic representation the two-step differentiation strategy of H9-hESCs differentiation into notochordal cells. (B) High magnification images of NOTO-mCherry positive cells during notochordal differentiation. NOTO reporter expressing cells observed in day 4 (LAF) and day 6 (LAFC treatments) of differentiation with a fluorescence microscope. (C) Expression of early notochord markers during differentiation. RT-qPCR analyses showed induced expression of NOTO, FOXA2, FOXA1, Brachyury (T),SHH, and Noggin (NOG) on 4 and 6 days of differentiation in H9-hESCs.GAPDH served as internal control and data is represented as expression relative to undifferentiated H9-hESCs (day 0). All data are represented as mean ± SEM from three independent experiments. *P≤0.01, as compared to control.

