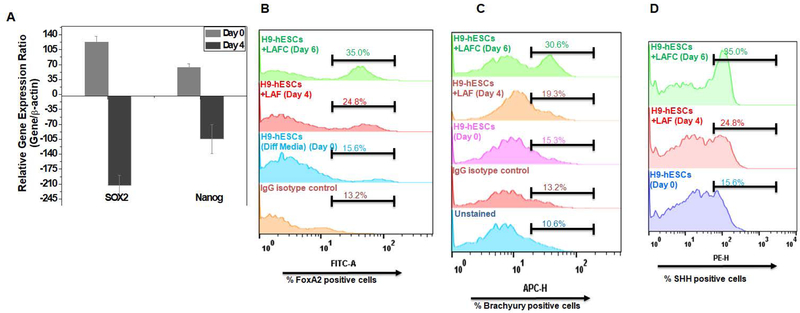
Figure 4: Characterization of H9-hESCs differentiation into notochordal cells:
(A) RT-qPCR analyses showed decreased expression of NANOG and SOX2 on day 4 differentiation in H9-hESCs. GAPDH served as internal control and data is represented as expression relative to undifferentiated H9-hESCs (day 0). Flowcytometric histogram showing percent cells expressing (B) FOXA2, (C) Brachyury and (D) SHH during day 0, day 4 and day 6 of differentiation of H9-hESCs in monolayer. Cells were harvested and stained with anti-Barchyury-APC or anti-FOXA2-FITC or anti-SHH-PE labeled antibodies. All data are represented as mean±SEM from three independent experiments. *P≤0.01, as compared to undifferentiated control (day 0).

