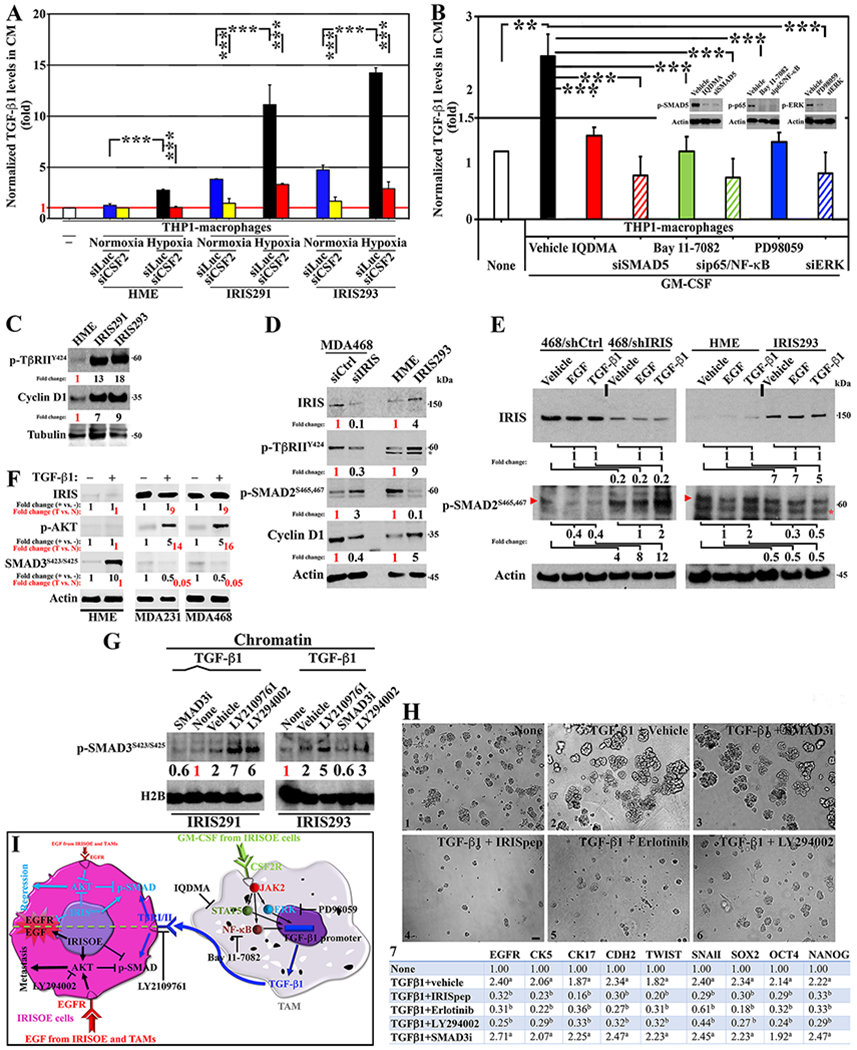
Figure 2. TGF-β1 from macrophages enhances IRISOE cells aggressiveness.

(A) ELISA for TGF-β1 in CM from indicated cells and treatments (n=3, in triplicates). (B) ELISA for TGF-β1 in CM from indicated cells and treatments (n=3, in triplicates). (C) Expression of p-TβRIIY422 and CyclinD1 in indicated cells (n=3). (D) Expression of IRIS, p-TβRIIY422, p-SMAD2S465,S467, and CyclinD1 in indicated cells (n=3). (E) Expression of IRIS and p-SMAD2S465,S467 in indicated cells and treatments (n=3). Arrowhead shows p-SMAD2S465,S467 position and asterisk shows non-specific band. (F) Expression of IRIS, p-AKT, and p-SMAD3S423,S425 in indicated cells and treatments (n=3). (G) Expression of p-SMAD3S423,S425 in indicated cells and treatments (n=3). (H) Representative images of acini of indicated cells in Matrigel supplemented with indicated factors/drugs (n=3, in triplicates). Scale bar =50μm. (H7) Normalized mRNA expression (fold) of the indicated factors in indicated cells and treatments. a is p=0.05, and b is p=0.001 (n=3, in triplicates). (I) A schematic representation of the data presented above.
