
Figure 4. Syngeneic model for the bidirectional interaction of IrisOE cells and TAMs.
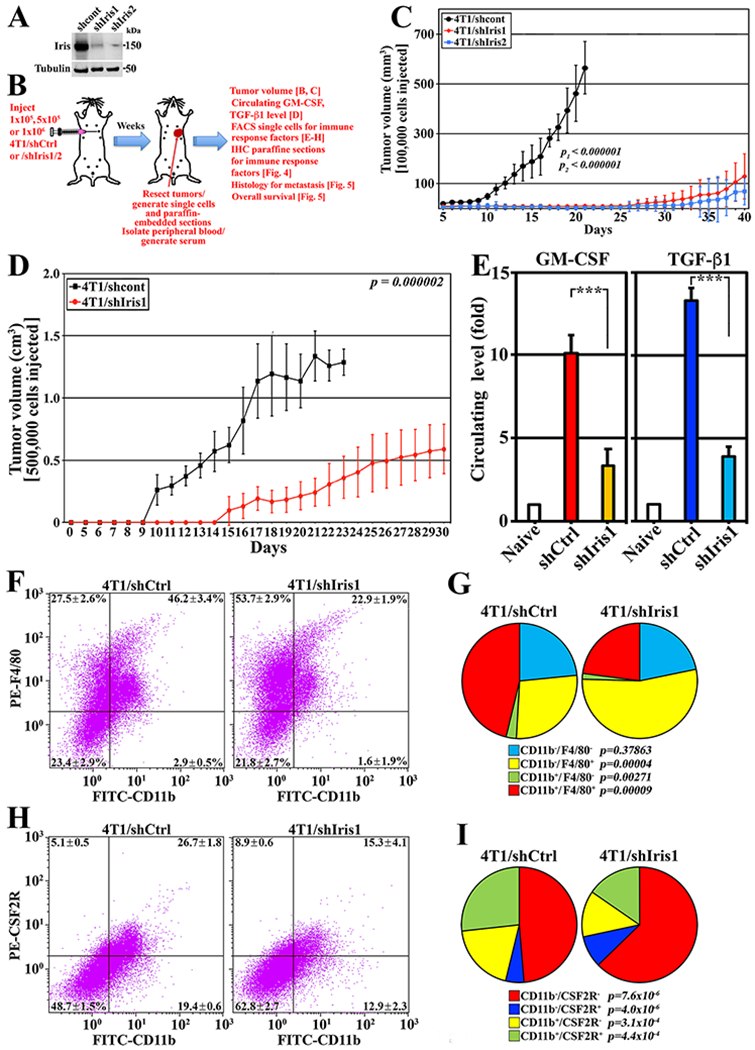
(A) Schematic description of the assays below. (B) Iris expression in 4T1/shCtrl, 4T1/shIris1, or 4T1/shIris2. (C and D) Volume of tumors developed in BALB/c mice injected with indicated cells. (E) Levels of GM-CSF and TGF-β1 in the circulation of indicated mice. (F and G) Percentage of indicated cell fractions in indicated tumors. (H and I) Percentage of indicated fractions in indicated tumors.