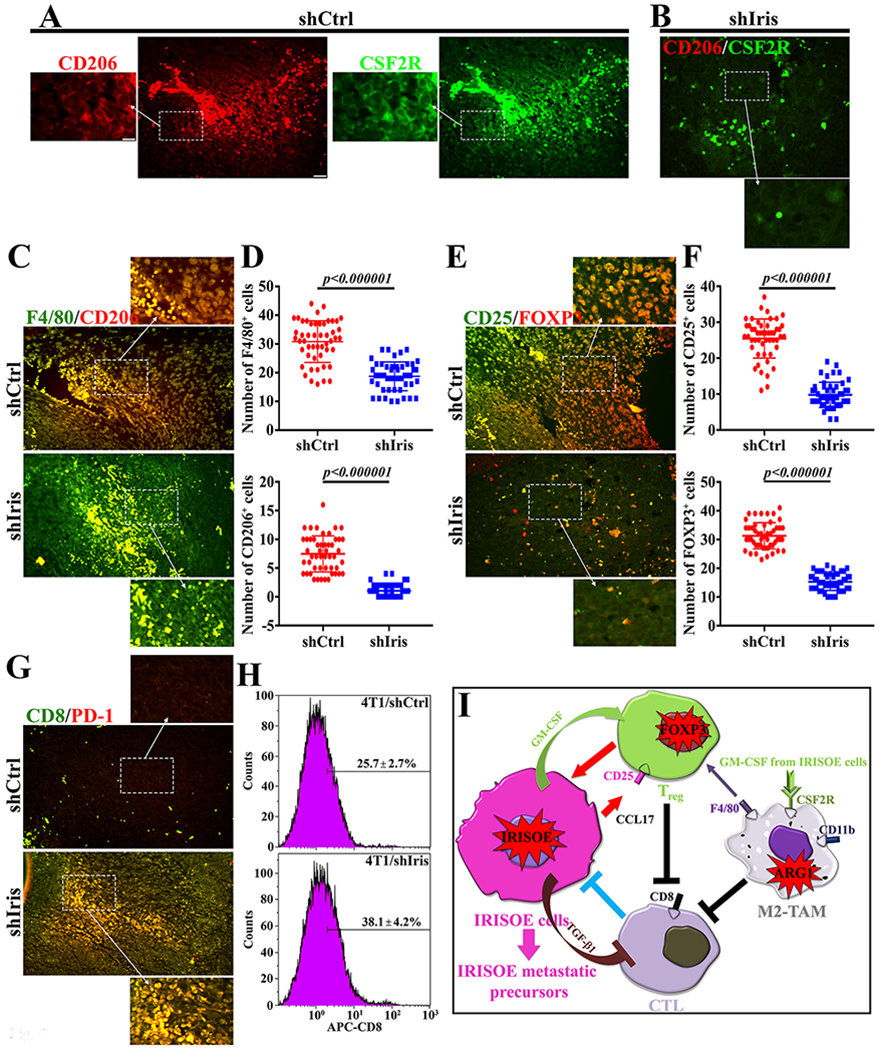
Figure 5. Immunosuppressive microenvironment in IrisOE TNBC syngeneic tumors.

(A and B) Co-expression of M2 biomarker; CD206 and CSF2R in indicated tumors. (C) Co-expression of CD206 and general macrophage marker; F4/80 in indicated tumors. (D) Quantitative analysis of data in (C). (E) Co-expression of the Treg markers; CD25 (membranous) and FOXP3 (nuclear) in indicated tumors. (F) Quantitative analysis of data in (E). (G) Co-expression of the CTL markers; CD8 and PD-1 in indicated tumors. (H) FACS analysis of CD8+ cells in indicated tumors. (I) Schematic representation of the data presented above. Scale bar=100, insets=25μm.
