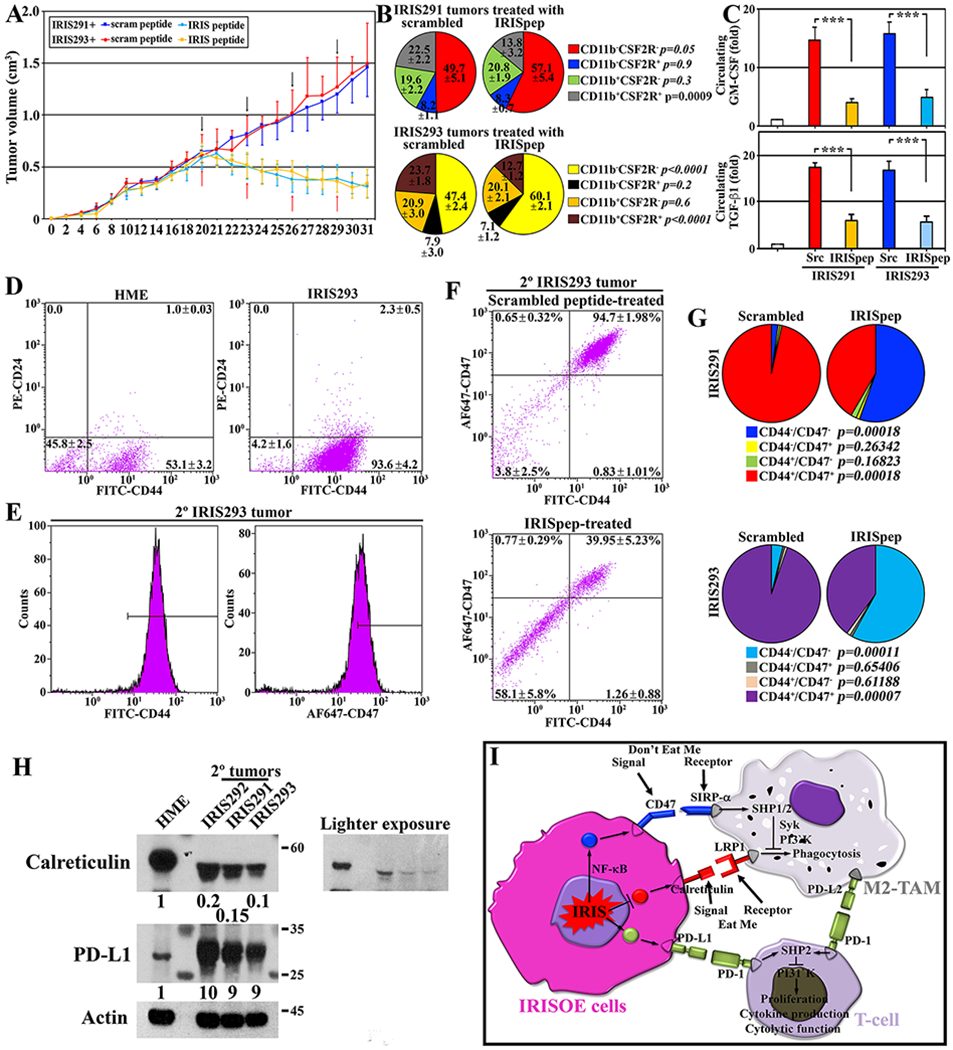
Figure 7. IRIS inactivation triggers immunity in TNBC tumors.

(A) Volume of established tumors in athymic mice intratumorally injected with scrambled (black arrows) or IRISpep (red arrows). (B) Percentage of indicated fractions in indicated tumors. (C) GM-CSF and TGF-β1 ELISA on sera from indicated tumor-bearing mice. (D) FACS for CD44 and CD24 staining in indicated cells. (E) FACS for CD44 (left) and CD47 (right) in 2° IRIS293 tumors. The figures are representative of 10 tumors. (F) FACS for CD44/CD47 on indicated tumors. (G) Summary of tumors IRIS291 and IRIS293 data shown in (F). P values are shown. (H) Expression of calreticulin, PD-L1 in HME, 1° IRIS292, or 2° IRIS291 or 2° IRIS293 tumors. The data is representative of five tumors/cell line. (I) Schematic representation of the data presented above.
