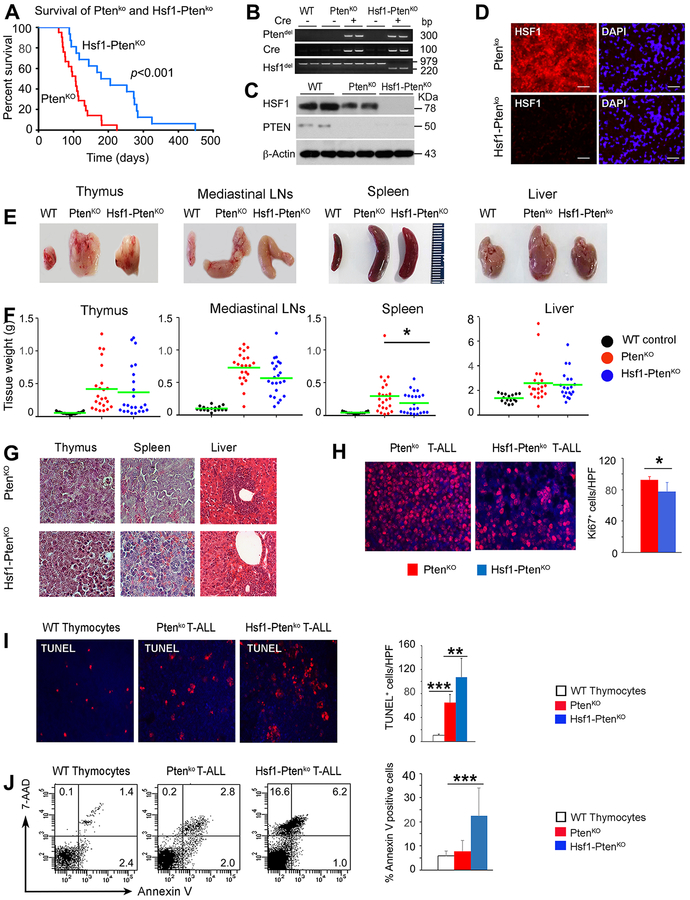
Figure 1. HSF1 ablation attenuates PTEN-loss-induced T-ALL development and progression.
(A) Kaplan-Meyer plot of tumor-free survival curves for PtenKO (n=30) and Hsf1-PtenKO (n=25) male and female mice. p value was derived using Log-Rank test.
(B) PCR-based verification of Hsf1 and/or Pten allele deletion or Cre allele expression performed with DNA isolated from thymus of WT control mice or T-ALLs of the indicated genotypes.
(C) Efficient inactivation of HSF1 and/or PTEN is demonstrated by Western blot analysis in T-ALL cell extracts from PtenKO or Hsf1-PtenKO mice. Samples from thymus of normal WT mice were used as a control. β-actin was used as loading control.
(D) Representative IHC of HSF1 in thymic T-ALL sections from PtenKO or Hsf1- PtenKO mice. DAPI (blue) represents nuclear staining. Bars=20μm (n=4 mice).
(E) Representative macroscopic images of thymus, spleen, MLN and liver from indicated genotypes.
(F) Quantification of the organ weight in T-ALL-bearing animals of the indicated genotype. Normal WT mice without lymphomas were included as control (for panel F, n=16–23 mice/group).
(G) Representative histological analysis of thymus, spleen and liver from PtenKO or Hsf1- PtenKO mice. Mag. 40x. (n=5 mice/group).
(H-I) Ki67 and TUNEL staining of thymic T-ALL sections from PtenKO or Hsf1- PtenKO mice. Thymus of normal WT mice was used as a control. DAPI (blue) represents nuclear staining. Bars=20μm. Quantification of Ki67+ proliferating cells or TUNEL+ apoptotic cells per high-power field is presented (right panel) (n=4–5 mice per group).
(J) Apoptosis or necrosis monitored by FACS of thymic T-ALL cells from PtenKO or Hsf1- PtenKO mice stained for annexin V and 7-AAD. Thymocytes from WT mice were used as control. The percent of apoptotic (annexinVpos-7-AADneg/pos) and necrotic (annexinVneg-7-AADpos) cells is indicated in the quadrants. Quantification of apoptotic and necrotic cells is presented in the right panel (n=4 mice).
Analyses were performed at an advanced (preterminal) stage of T-ALL disease. For all panels, scale bars represent mean ± SD. Statistical significance is indicated (* p<0.05, ** p< 0.01, *** p< 0.001).

