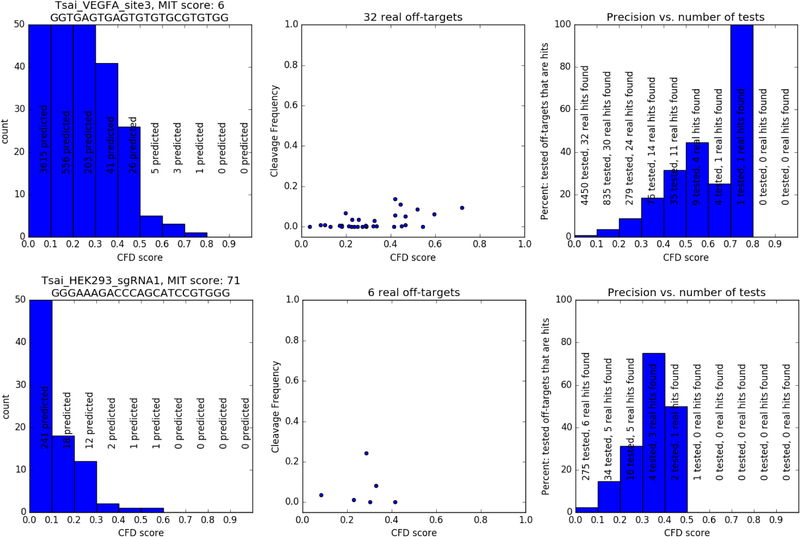
Figure 1 -.
Comparison of two guides: the first row shows data for the guide VEGFA_site3, the second row shows data for HEK293_sgRNA1. The first column shows histograms of the number of predicted off-targets by CFD (Cutting-frequency determination) score, the second column shows the off-targets actually cleaved in cells, the third column shows for various CFD cutoffs how many off-targets would have to screened and how many of these would be real off-targets.

