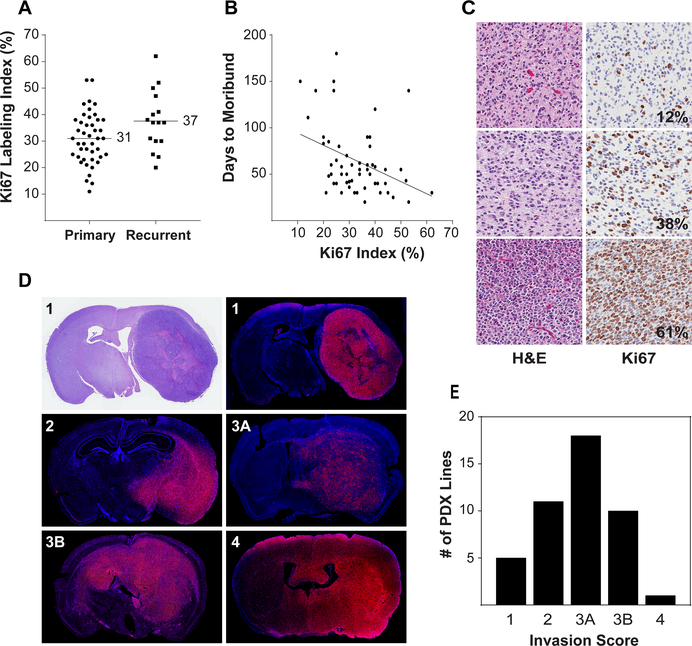
Figure 2: Proliferation and invasiveness of orthotopic PDX.
(A) Distribution of Ki67 labeling in PDX derived from primary and recurrent tumors. Ki67 labeling index was determined from tissue microarray cores from 58 orthotopic PDX lines. A mean of 4.5 cores was analyzed from one (n=4) or two (n=54) independent orthotopic tumors for each line. (B) Inverse correlation of Ki67 labeling with time to moribund following intracranial injection of tumor cells. (C) Representative H&E and Ki67 staining for PDX with low, moderate, and high Ki67 labeling indexes. (D) Tumor cell invasion was assessed by immunofluorescence using human specific antibodies to Lamin A/C. Representative sections showing invasion pattern scoring: 1 = unilateral, well-demarcated tumor; 2 = unilateral with infiltrating border; 3A = bilateral, restricted to contralateral midline structures; 3B = bilateral with clear involvement of both hemispheres; 4 = diffuse infiltration bilaterally. (E) Distribution of invasion patterns for 55 orthotopic PDX.

