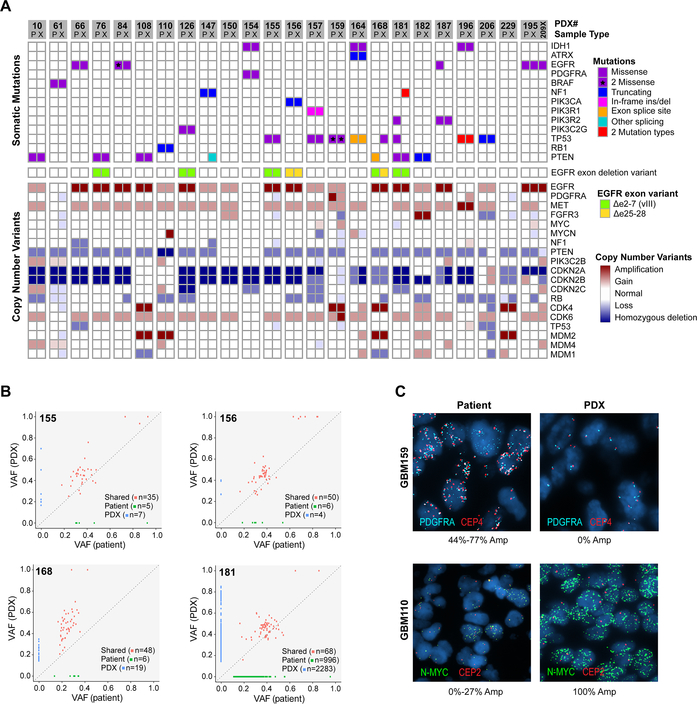
Figure 5: Comparison of somatic alterations in 24 matched patient tumors and derivative PDX.
(A) Somatic mutations and CNVs involving core glioma associated genes. Matched patient (P) and derivative PDX (X) models are adjacent for each pair. The GBM195 patient-PDX pair is also shown with GBM209 (209X), a PDX line established from the patient’s subsequent tumor recurrence. (B) Representative scatterplots comparing variant allele frequency (VAF) of four patient-PDX pairs. The four selected pairs reflect the spectrum of SNV conservation across the matched patient-PDX pairs. (C) FISH of matched patient and PDX tissue showing subclonal amplifications of N-MYC (GBM110) and PDGFRA (GBM159). Two distinct PDGFRA amplified subclones could be distinguished in the patient tumor by involvement of the centromeric probe (CEP4). %Amp denotes the percentage of tumor cells with >8 copies of the target probe with range given across 3 patient tumor blocks.

