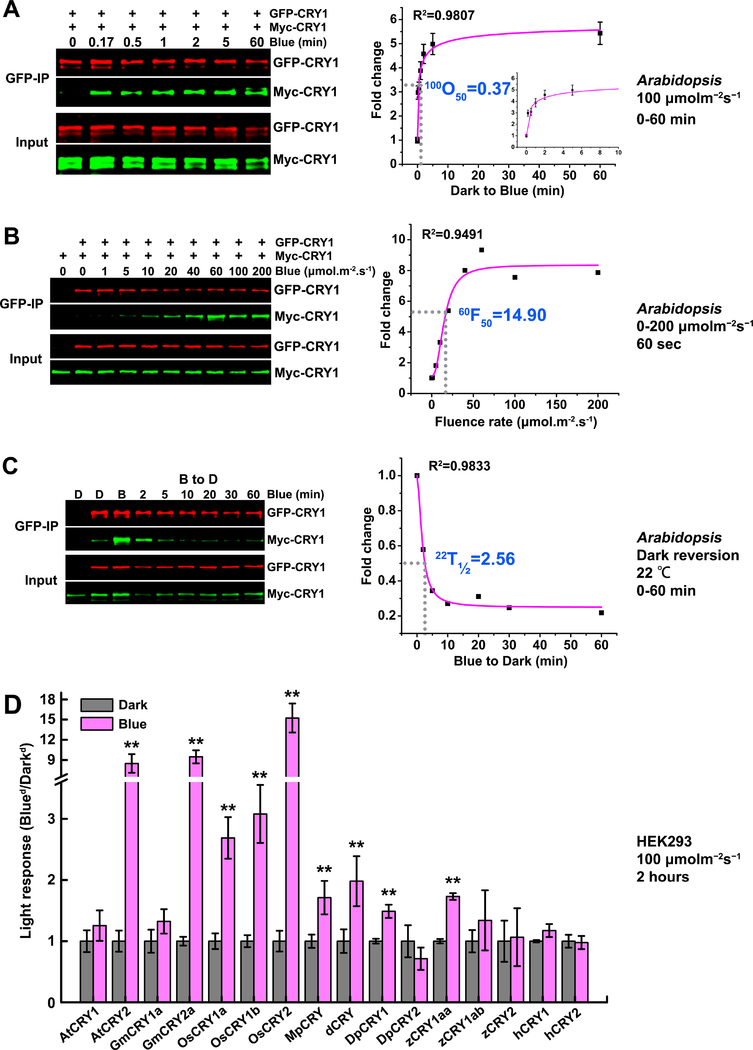
Figure 2. The photooligomerization of CRY1 in plants and the conservation of CRY homooligomerization across speices.
(A-C): CRY1 photooligomerization in plants (in vivo).
(A) The kinetics analyses of CRY1 photooligomerization in response to blue light in plants. Seven-day-old Arabidopsis seedlings co-expressing GFP-CRY1 and Myc-CRY1 were grown on petri dishes in the dark, exposed to blue light of 100 μmolm−2s−1, and tissues were collected at the indicated time (minute). GFP-CRY1 were co-immunoprecipitated by GFP-trap beads. The immunoblots were probed by the anti-GFP and anti-Myc antibody, and quantified by the Image Studio Lite software in the Odyssey® CLx System (LI-COR). The Myc-CRY1 (co-IP product) were normalized by the respective GFP-CRY1 (IP product), and presented as Fold Change (FC) by the formula FC = [Myc-CRY1/GFP-CRY1]Blue / [Myc-CRY1/GFP-CRY1]Dark. 100O50 indicates the time (minute) required to reach 50% saturation of CRY1 photooligomerization in plants at the fluence rate of 100 μmolm−2s−1 of blue light. The insert small graph shows the first 10 minutes in the curve. The data for curve fitting were derived from three technical repeats by performing three independent western blots. Standard errors are shown.
(B) The fluence-rate response analyses of CRY1 photooligomerization in plants. Seven-day-old Arabidopsis seedlings co-expressing GFP-CRY1 and Myc-CRY1 were exposed to blue light of the indicated fluence rates for 60 seconds. The same analyzation was performed as described in (A). 60F50 indicates the fluence rate of blue light required to achieve 50% CRY1 photooligomerization after light exposure for 60 seconds.
(C) The dark reversion analyses of CRY1 photooligomerization. Seven-day-old Arabidopsis seedlings co-expressing GFP-CRY1 and Myc-CRY1 were irradiated with 30 μmolm−2s−1 blue light for 30 min before transferring to darkness for the indicated times. 22T1/2 indicates the time (minute) required to reverse 50% of CRY2 photooligomers into monomers at the temperature of 22°C.
The data in (A-C) were analyzed by Logistic Nonlinear Curve Fit method. R2 stands for coefficient of regression.
(D): The conservation of CRY homooligomerization across speices.
HEK293 cells were transfected with equal amount of two plasmids encoding Flag-CRY or Myc-CRY from different species: AtCRYs of Arabidopsis, GmCRYs of soybean (Glycine max), OsCRYs of rice (Oryza sativa), MpCRY of liverwort (Marchantia polymorpha), dCRY of Drosophila, DpCRYs of Monarch butterfly (Danaus plexippus), zCRYs of Zebrafish, and hCRYs of human (Homo sapien). After transfection, cells were exposed to 100 μmolm−2s−1 for 2 hours or left in the dark. Flag-CRYs were co-immunoprecipitated by Flag-agrose gels. The immunoblots were probed by the anti-Flag antibody to detect IP product and anti-Myc antibody to detect Co-IP product. Three independent immunoblots were quantified by the Image Studio Lite software in the Odyssey® CLx System (LI-COR). The Myc-CRY2 (co-IP product) were normalized by the respective Flag-CRY2 (IP product), and presented as light response by the formula: light response = [Myc-CRY2/Flag-CRY2]Blue / [Myc-CRY2/Flag-CRY2]Dark. Mean values are shown (n=3, **P≤0.01). The representative immunoblots for quantification were shown in supplemental figure S3.

