
Figure 4.
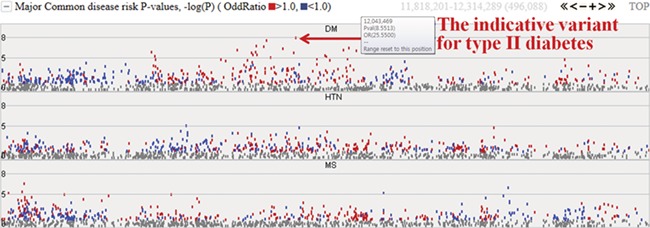
Disease risks of type II diabetes (DM), hypertension (HTN) and metabolic syndrome (MS). Each dot represents risk P values (–logP). The red and blue colour indicates odds ratio ≥1.0 and <1.0, respectively. The horizontal axis denotes the genomic positions of the chosen chromosome (chr1).