
FIGURE 4.
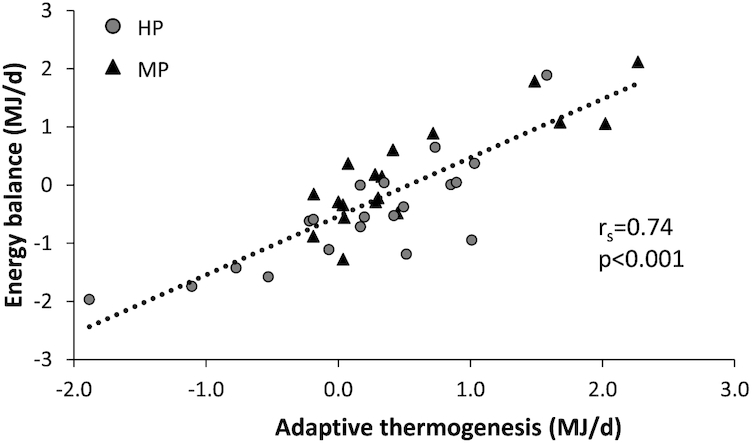
Scatter plot of adaptive thermogenesis and EB assessed in participants with prediabetes in the postobese state during 48-h respiration chamber measurements. Participants received an MP (n = 18) or HP (n = 20) diet. EB was positively associated with adaptive thermogenesis (rs = 0.74; P < 0.001). Associations were investigated using Spearman correlation analysis. EB, energy balance; HP, high protein; MP, moderate protein.