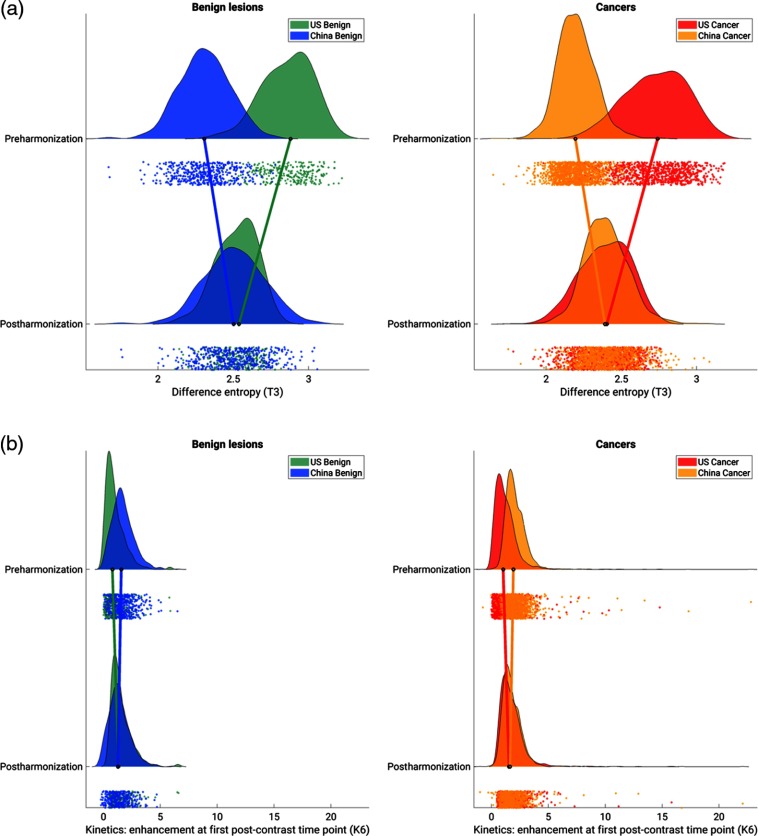
Fig. 1.
Example raincloud plots for the distribution of the values of (a) the texture feature of difference entropy and (b) the kinetic curve feature of enhancement at first postcontrast time point, before and after harmonization for benign lesions and cancers within each population. The black circles at the base of each distribution indicate the median of the distribution, and the connecting lines between the medians of the distributions pre- and postharmonization demonstrate the change of the median with harmonization of the feature. The dots below each distribution show individual data points.

