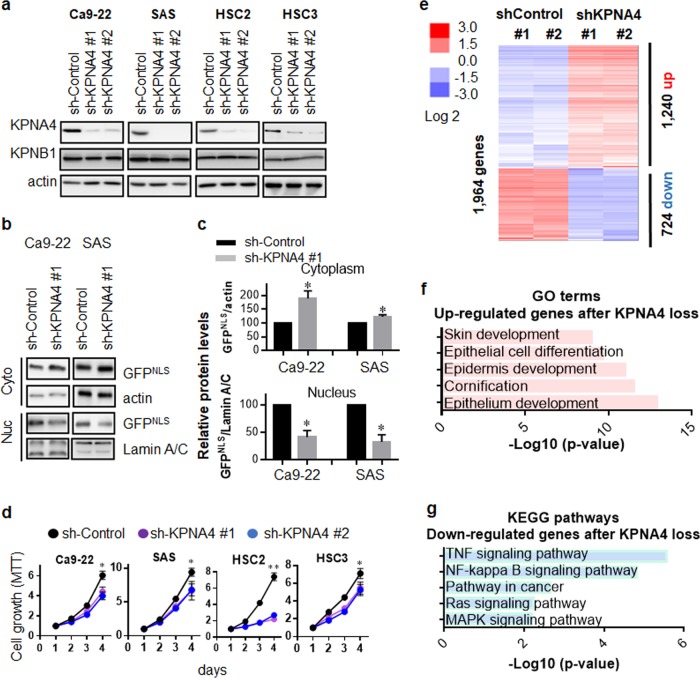
Fig. 2. KPNA4 mediates cellular malignant phenotype and affects gene expression in HNSCC.
a Western blot analysis of each KPNA4 as well as KPNB1 in various HNSCC cell lines expressing shRNA for KPNA4. b Western blot analysis of GFPNLS in both cytoplasmic and nucleus fraction. c Quantification of the protein levels were performed. Data show mean ± SD from three independent experiments (n = 3). One sample t test was performed using GraphPad QuickCalcs. *p < 0.05. d Short-term proliferation was analyzed MTT assay Data represent means ± SD (n = 3). e The heat map from microarray data showing upregulated and downregulated genes after knockdown of KPNA4. f GO analysis of the upregulated genes upon KPNA4 depletion. g Pathway analysis of the downregulated genes after KPNA4 knockdown.

