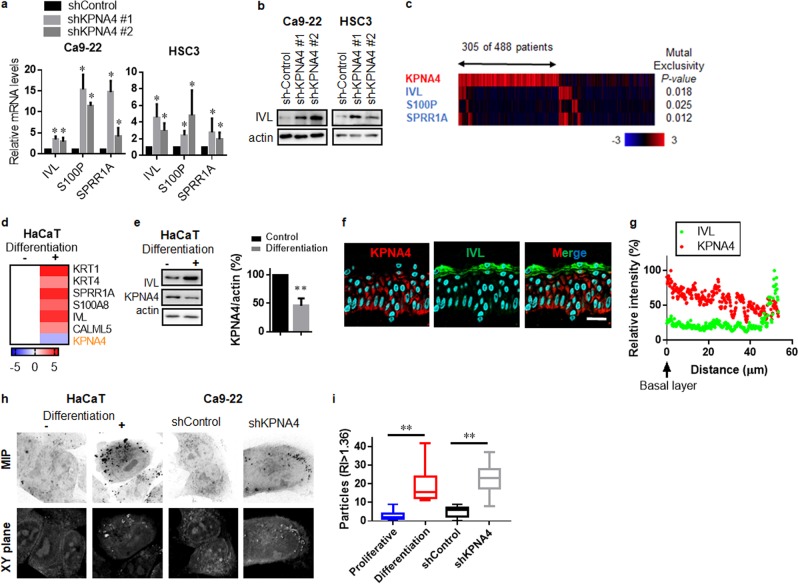
Fig. 3. KPNA4 prevent epidermal differentiation in HNSCCs.
Epidermal-differentiation genes were analyzed by qRT-PCR (a) and western blot analysis (b) in HNSCCs cells. qRT-PCR data represent means ± SD (n = 3). c The heat map showing mutual exclusivity between KPNA4 expression and differentiation-related genes. Samples were divided according to mRNA expression levels [mRNA expression z-Scores (RNA-Seq V2 RSEM) >mean +2.0SD] from the TCGA cohorts. P values are based on the fisher exact test. Epidermal-differentiation genes and KPNA4 were analyzed by qRT-PCR (d) and western blot analysis (e, left) and quantification of KPNA4 proteins levels (e, right) in HaCaT cells. Data represent means (qRT-PCR, n = 3) or means ± SD (Western Blot, n = 3). f, g Expression profiles of KPNA4 and IVL in normal skin tissue (f). Bar = 30 μm. Fluorescent intensity was quantified (g). h, i Three-dimensional reflective index tomographic analysis (h) of HaCaT and HNSCC cells. MIP means maximum intensity projection. i Quantification of granulated particles were analyzed using TomoStudio. The two-tailed Student’s t test was used to analyze the potential statistical difference between two groups. *p < 0.05.

