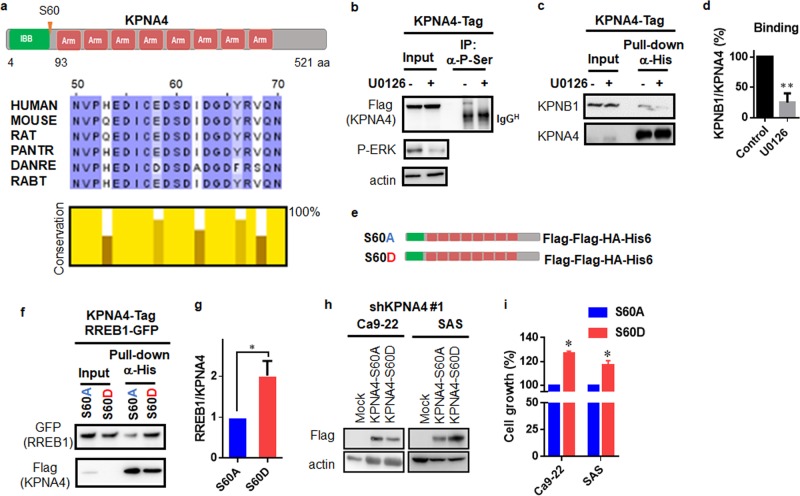
Fig. 5. Phosphorylation of KPNA4 at S60 determines KPNA4 transport activity.
a Schematic representation of the structural and functional domains and phosphorylation site of KPNA4 (upper panel), and evolutionarily conserved IBB domain in KPNA4 protein (bottom panel). b–d SAS stably expressing KPNA4-tag was subjected to IP analysis under MAPK inhibition. At 24 h treatment of U0126 (10μM), cells were harvested, lysed, and proceeded for pull-down assay using antiphospho-Ser antibody (b) or His-tag pull-down assay (c). Quantification of the interaction between KPNB1 and KPNA4 (d). Relative interacting amounts was normalized by KPNA4 levels, then amounts of KPNB1 without U0126 was considered as 100% (n = 3). One sample t test was performed using GraphPad QuickCalcs. **p < 0.01. e Diagram of mutation conducted in KPNA4. f Interactions of KPNA4 and RREB1 were addressed by western blot analysis. At 48 h after transfection, cells were harvested, lysed, and proceeded for His-tag pull-down assay. g Quantification of the interaction between KPNA4 and RREB1. Relative interacting amounts were normalized by KPNA4 levels, then amounts of RREB1 interacting KPNA4S60A was considered as 100% (n = 3). One sample t test was performed using GraphPad QuickCalcs. *p < 0.05. h Western blot analysis of exogenous KPNA4S60A or KPNA4S60D. i Short-term proliferation ability was analyzed MTT assay using HNSCCs expressing either KPNA4S60A or KPNA4S60D under shKPNA4 expression. Data represent means ± SD (n = 3). One sample t test was performed using GraphPad QuickCalcs. *p < 0.05.

