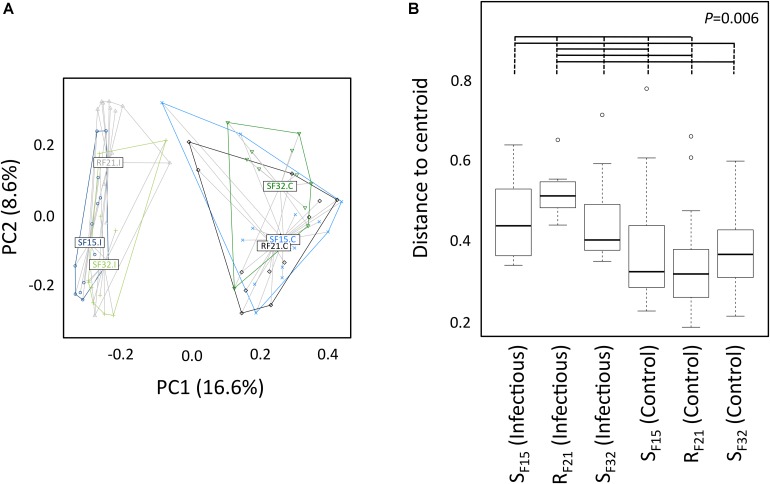
FIGURE 5.
Microbiota compositions between oyster families in controlled (hatchery) and infectious (field) conditions. (A) Principal coordinate analysis (Bray–Curtis dissimilarities between samples). Each dot corresponds to one individual. Colors correspond to oyster families in controlled (C) and infectious (I) conditions. Labels are displayed at the barycenter of dots. (B) Multivariate homogeneity of group dispersions. P-value corresponds to the global test. Horizontal lines above boxplots indicate significant pairwise comparisons between group levels (post hoc analyses) (n = 80).

