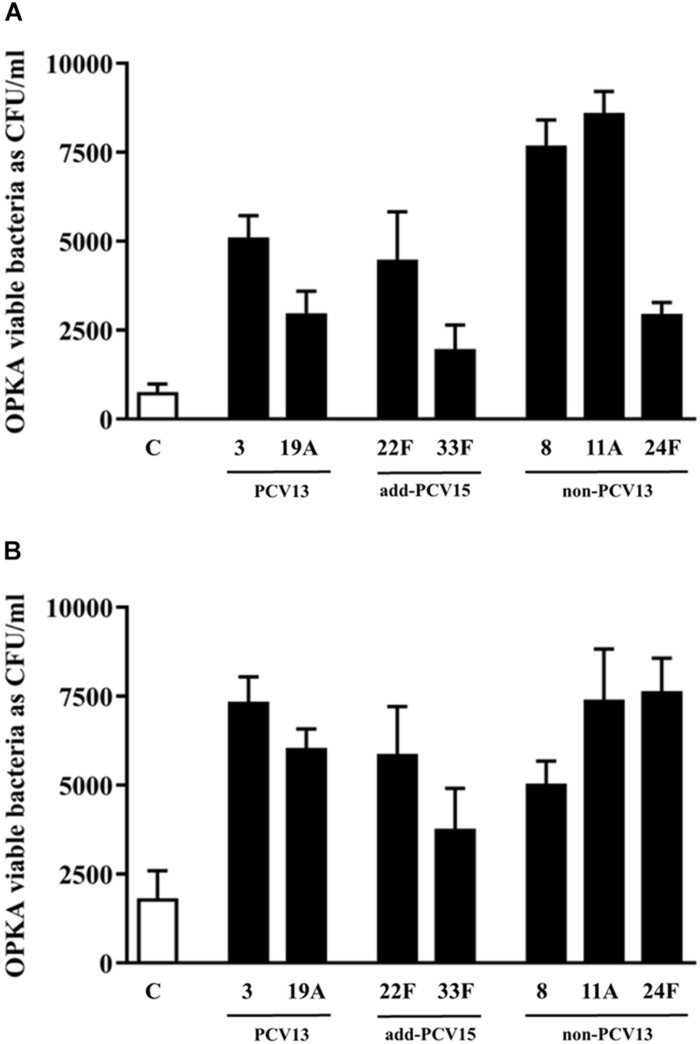
FIGURE 5.
Influence of different CPS in the evasion of opsonophagocytosis. (A) Bacterial survival of control strain M11 expressing different CPS and grown as a planktonic culture. (B) Bacterial survival of control strain M11 expressing different CPS and grown as a biofilm. Error bars represent standard deviations, and asterisks mark results that are statistically significant (two-tailed Student’s t-test: *P < 0.05; **P < 0.01; ***P < 0.001).

