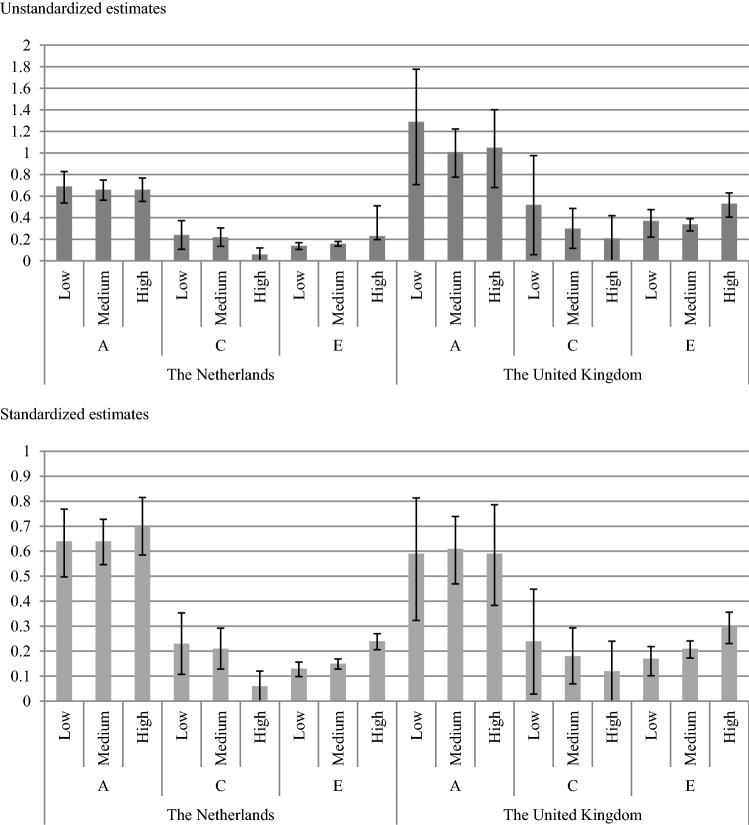
Fig. 1.
Unstandardized and standardized estimates of variance components from the best fitting ACE model with 95% confidence intervals. The top half of the figure represents unstandardized estimates of variance components due to A (additive genetic factors), C (shared environment), and E (nonshared environment) for the different SES strata (i.e., low, medium, and high) for the Netherlands on the left and the United Kingdom on the right, respectively. The lower half of the figure displays the standardized estimates of variance due to A, C, and E across SES strata and countries

