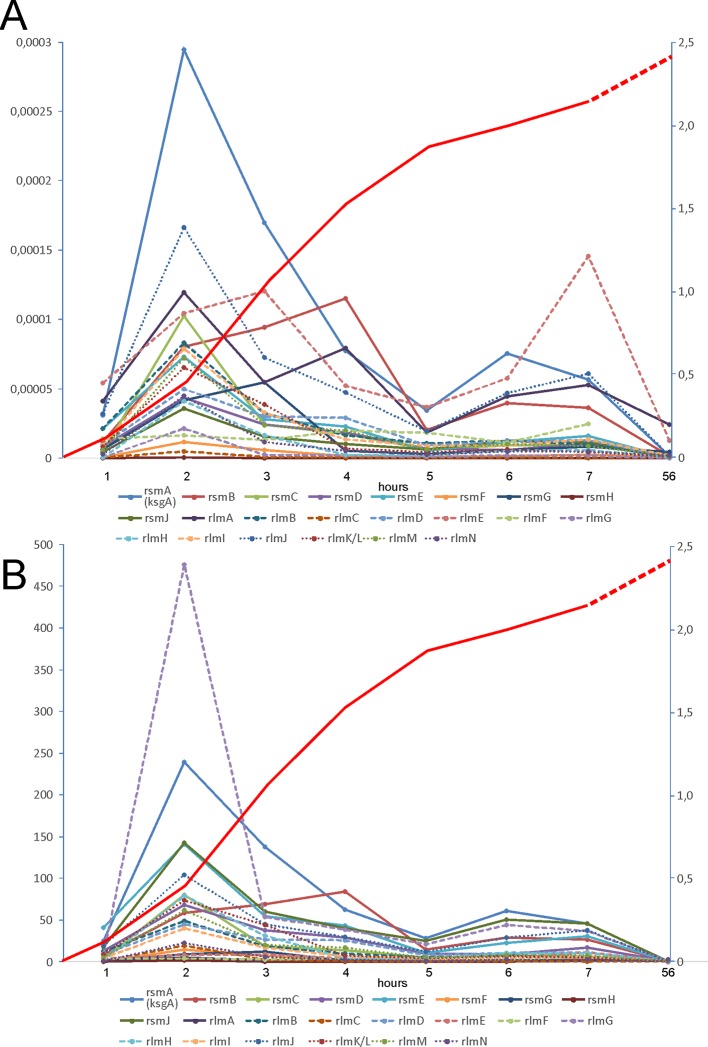
Figure 1.
Expression of rRNA methyltransferase genes at different phases of E. coli culture growth. (A) Amounts of rRNA methyltransferases mRNA relative to the amount of 16S rRNA as revealed by RT qPCR (left scale). (B) Change in the proportion of rRNA methyltransferases mRNA to the 16S rRNA relative to that in the stationary phase (left scale). The keys to the graphs are shown below the panels. Red curves (right scale) correspond to the A600 of the cell culture.

