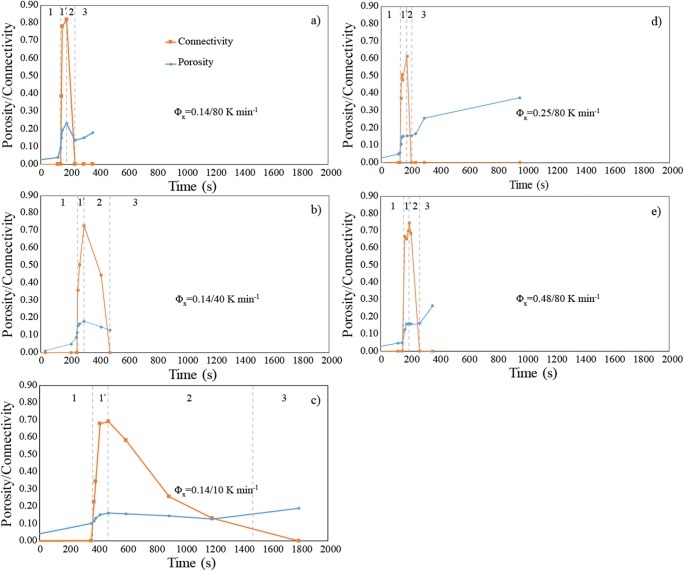
Fig. 2.
Evolution of porosity and percolative connectivity with time during the single experiments. a–c Sample DRY1-14-34, DRY1-14-42 and DRY1-14-31 with bulk crystallinity of 14 vol.% and heating rates of 80, 40, and 10 K min−1, respectively. d Sample DRY2-25-38 with a bulk crystallinity of 25 vol.% at a heating rate of 80 K min−1. e Sample DRY2-48-46 with a bulk crystallinity of 48 vol.% at a heating rate of 80 K min−1. The different regimes of sample response are illustrated. Regime 1 corresponds to the brittle-viscous regime with 1′ indicating the onset and increase of connectivity at ΦC. Regime 2 corresponds to the outgassing regime with reduction of connectivity until complete isolation (C = 0). Regime 3 corresponds to the viscous regime with increase of porosity and no percolation (C = 0). Errors on porosity and connectivity are smaller than symbols

