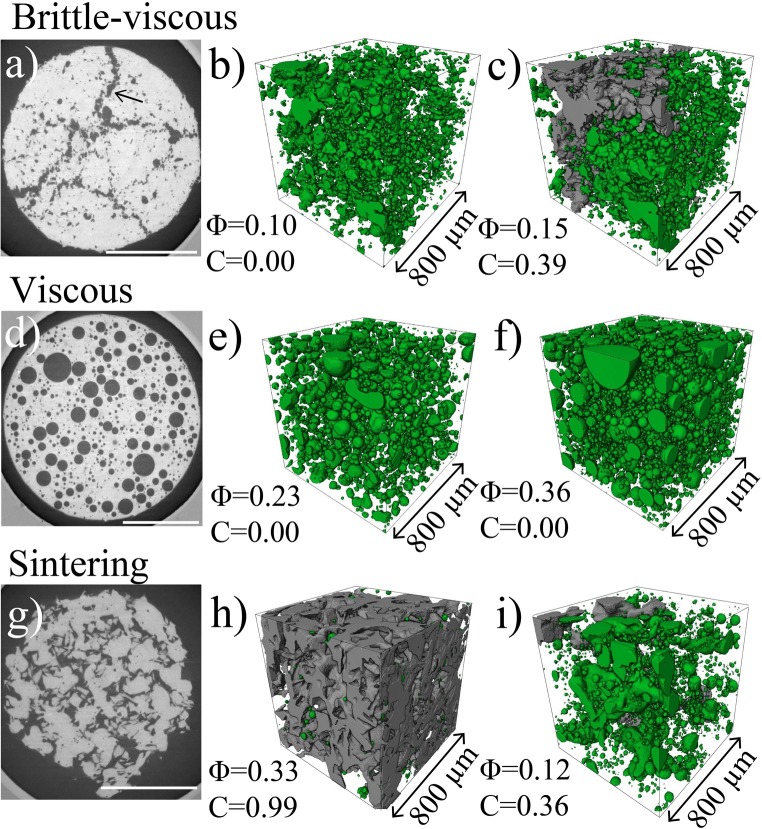
Fig. 7.
X-ray tomography textural images of crystal-rich synthetic magmas used here. a–c 2D tomography image (a) and 3D volume renderings (b, c) showing the bubble-chain pathways and the evolution of connectivity with porosity in the brittle-viscous regime. d–f) 2D tomography image (d) and 3D volume renderings (e–f) showing the increase of porosity without onset of connectivity in the viscous regime. g–i 2D tomography image (g) and 3D volume renderings (h, i) showing the evolution of connectivity with porosity in the sintering regime with 40 vol.% quartz crystals. Connected and isolated bubbles/pores are represented in grey and green in the volume renderings, respectively. Scale bars in (a), (d) and (g) correspond to 1 mm

