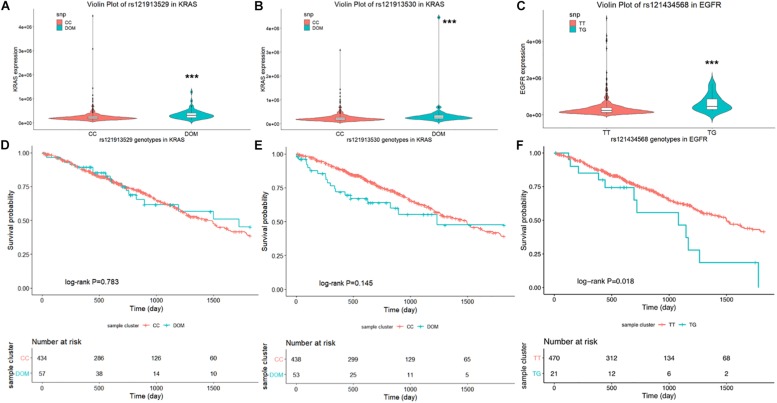
FIGURE 1.
Violin plot displays the distribution of mRNA expression levels in each genotype. In the lung AC SNPs rs121913529 (A) and rs121913530 (B) in KRAS, rs121434568 in EGFR (C), the Y-axis represents the relative expression level of harboring genes and the plot with error bars representing the 25 and 75% quantiles. Kaplan–Meier survival plot for SNPs: (D) rs121913529, (E) rs121913530 and (F) rs121434568. The unadjusted Kaplan–Meier curve was on the top and the number of events were showed in the risk table below. ***P < 0.001.

