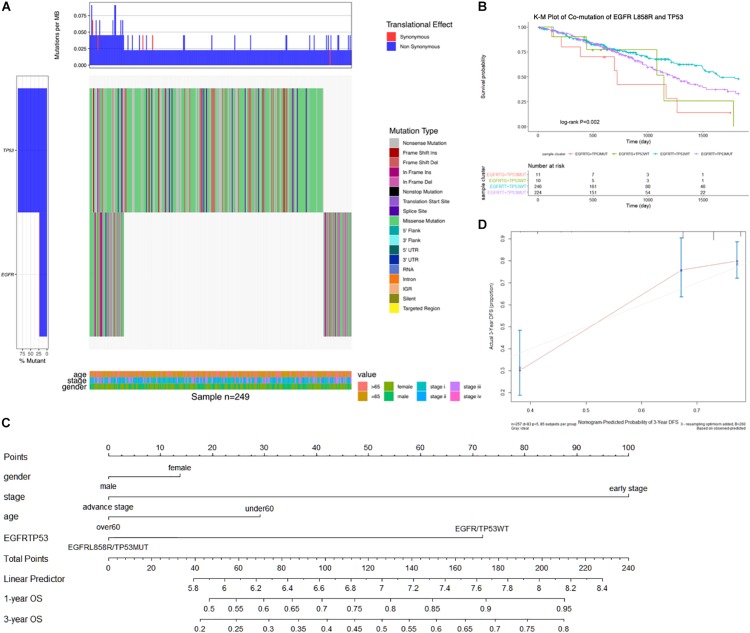
FIGURE 2.
(A) The oncoprint waterfall plot of predictive combination effect of TP53 and EGFR mutation in lung AC. The mutation was colored as the legend in the right of plot, the left barplot indicated the probability of genetic mutation in each patient, while the upper barplot showed genetic mutation per gene. In the bottom was annotated by age, gender, and cancer stage. (B) Kaplan–Meier curve plot presented association between clinical outcomes and combination of EGFRL858R and TP53 mutation. (C) Nomogram was constructed to combine signature with clinical features and EGFRL858R/TP53 mutation status by summing the scores. (D) Calibration plot indicated the nomogram had a predictive power for overall survival. EGFRTG + TP53MUT, EGFRL858R with TP53MUT status; EGFRTG + TP53WT, EGFRL858R with TP53WT status; EGFRTT + TP53WT, EGFRWT with TP53WT status; EGFRTT + TP53MUT, EGFRWT with TP53MUT status. The unadjusted Kaplan–Meier curve was on the top and the number of events were showed in the risk table below.

