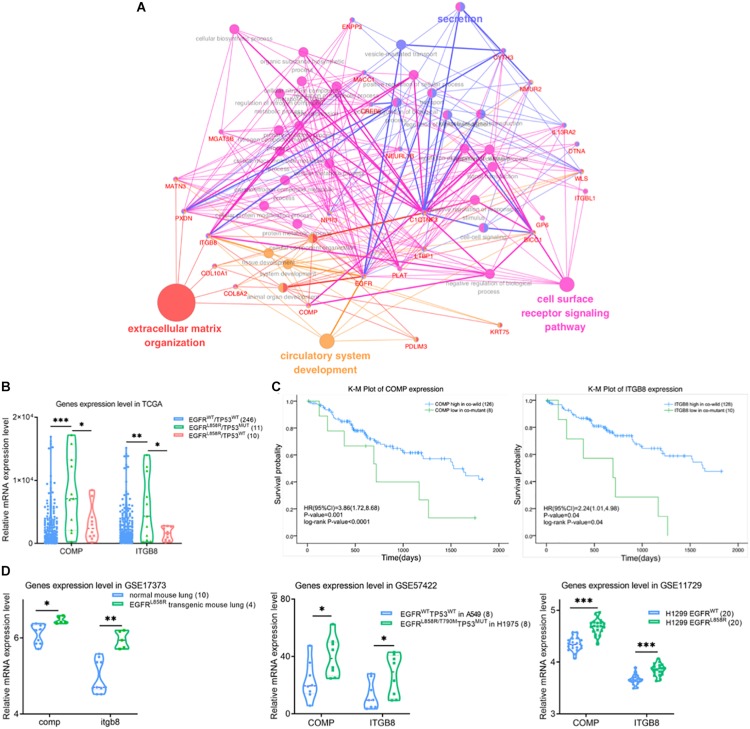
FIGURE 4.
(A) Gene ontology biological process enrichment network analysis using ClueGO for differentially expressed genes in brown module. The color of nodes represents the gene enriched in corresponding GO-bp terms. (B) Violin plot of differential expression level of COMP and IGTB8 between co-wild EGFR/TP53, EGFRL858R/TP53MUT and EGFR/TP53MUT groups. Kaplan–Meier survival plot for COMP and IGTB8 (C) combined with mutation state of EGFRL858R and TP53. The unadjusted Kaplan–Meier curve was on the top and the number of events were showed in the risk table below. (D) Correlations were detected between COMP or IGTB8 and EGFR expression level in GSE17373, GSE57422 and GSE11729 datasets, respectively. The sample were present in the figure legends. ∗P < 0.05, ∗∗P < 0.01, ∗∗∗P < 0.001. NC, negative control; WT, wild-type; MUT, mutant type.

