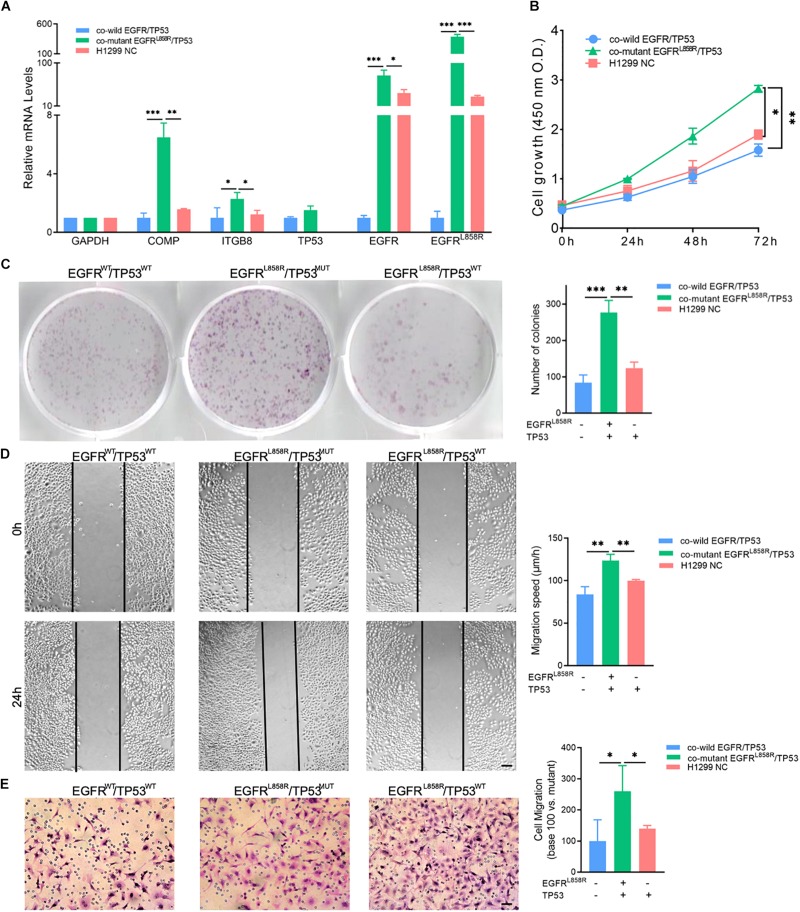
FIGURE 5.
(A) Expression of COMP, ITGB8, TP53, EGFR, and EGFRL858R in H1299 and A549 cells after transfection. (B) CCK-8 assay detected the proliferation by the value of OD490nm. (C) Representative cell colony formation assay and quantitative representation detected the proliferation of H1299 and A549 cells after transfection with EGFRL858R or NC in A549 or H1299. (D) Representative images of initial and final wounds in A549 or H1299 cells after transfection with EGFRL858R and negative control by wound-healing assay (Scale bar: 200 μm). (E) Representative transwell migration assays and quantitative representation after transfection with EGFRL858R or NC in A549 or H1299 cells (Scale bar: 100 μm). Assays were performed in triplicate. ∗P < 0.05, ∗∗P < 0.01, ∗∗∗P < 0.001. Error bars represent SEM. NC, negative control; WT, wild-type; MUT, mutant type.

