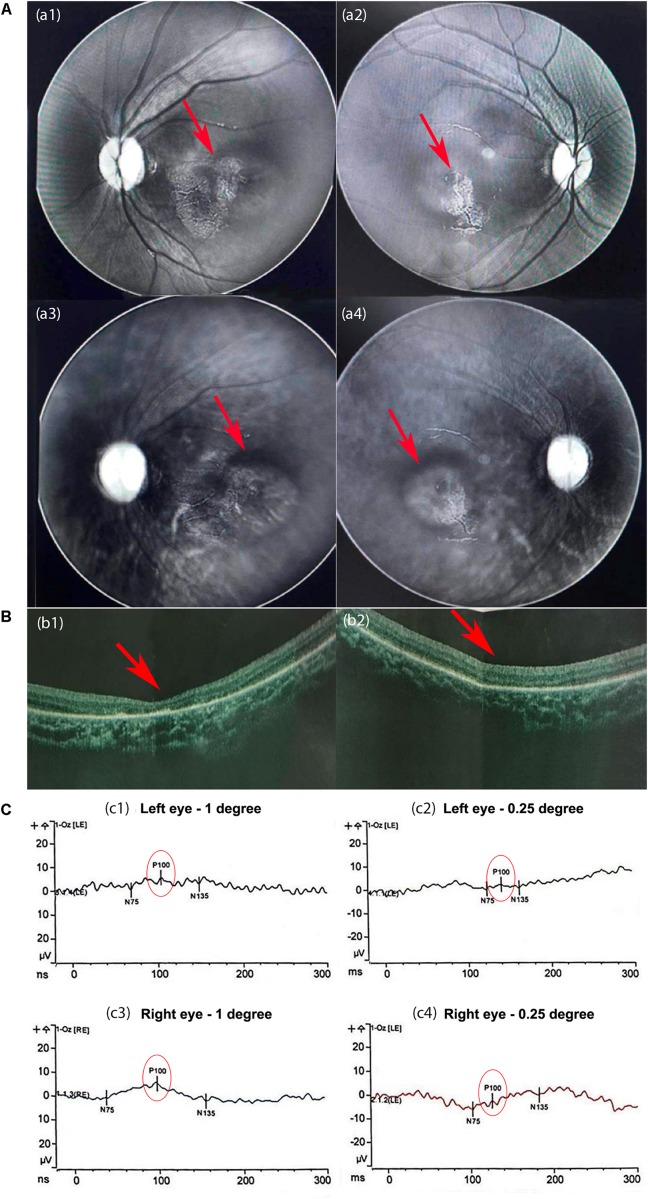
FIGURE 2.
The results of the eye examination. (A) Multispectral retinal image analysis. Abnormal fluorescence on the left (a1) and right (a2) retinas. Mass shadows in the macular region of the choroid in the left (a3) and right (a4) eyes. (B) Optical coherence tomography (OCT) images. The fovea centralis was absent from the center of the macula lutea of the left (b1) and right (b2) retinas (red arrows). The retinal pigment layers were intact. (C) The results of the pattern visual evoked potential (PVEP). At 1-degree checks, the latencies of P100 were normal but the amplitudes of P100 were moderately reduced in the left eye (c1) and slightly in the right eye (c3). (c2,c4) At 0.25-degree checks, the latencies of P100 were significantly longer, and the amplitudes were severely reduced in both eyes.

