Fig. 2.
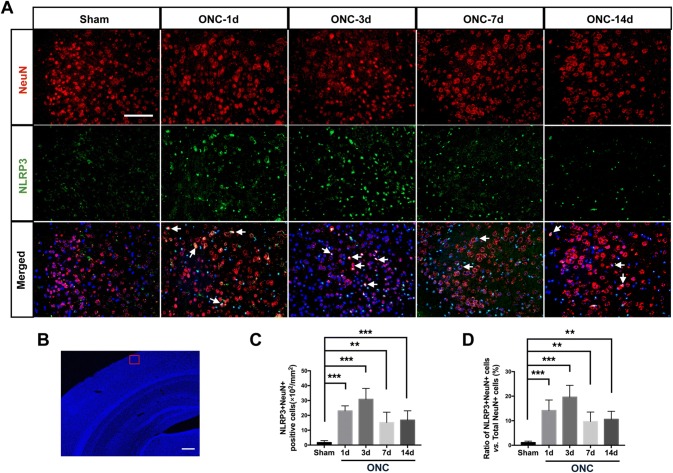
NLRP3 is activated in neurons of contralateral V1 1 day after ONC. A Double immunostaining for NeuN (red) and NLRP3 (green) in contralateral V1. Nuclear counterstaining by DAPI in merged images is pseudocolored in dark blue. Arrows indicate NeuN+NLRP3+ cells. Scale bar, 100 μm. B Region of interest for quantification in contralateral V1. Scale bar, 500 μm. C Quantification of NeuN+NLRP3+ cells. D Ratio of NeuN+NLRP3+ to total NeuN+ neurons. Data are presented as the mean ± SEM. **P < 0.01, ***P < 0.001 vs sham group, n = 6.

