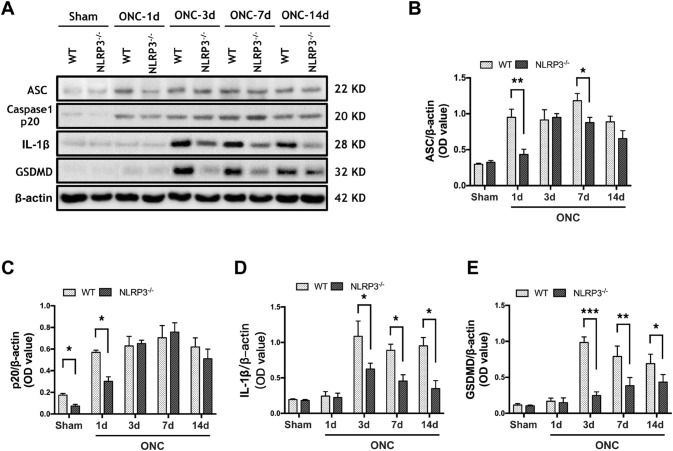
Fig. 3.
The expression levels of ASC, caspase-1 (p20), IL-1β, and cleaved GSDMD in the contralateral V1 of wild type (WT) mice and NLRP3-/- mice change following ONC. A Western blots showing the protein levels in contralateral V1. β-actin served as loading control. B–E Quantification of the changes in protein levels of ASC, caspase-1 (p20), IL-1β, and cleaved GSDMD. Data are presented as the mean ± SEM. *P < 0.05, **P < 0.01, ***P < 0.001, n = 4.

