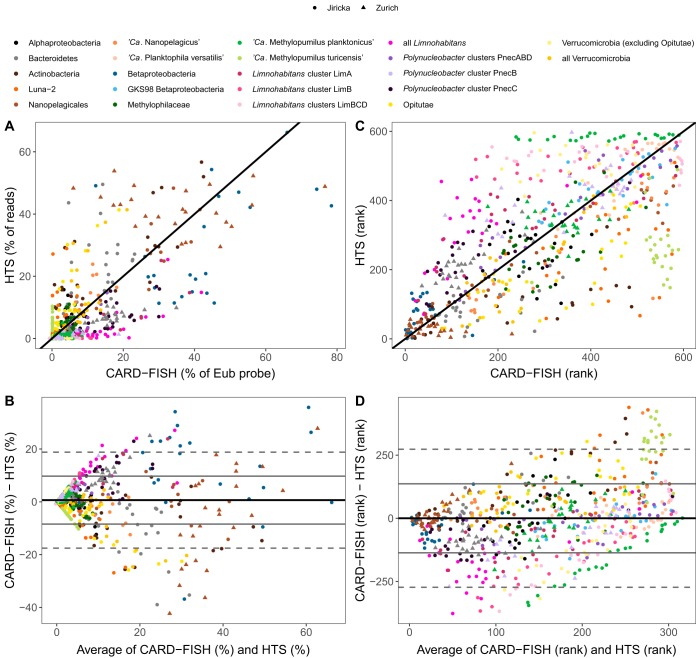
FIG 2.
(A) Scatterplot of relative abundances of studied bacterial groups (pooled data sets from both lakes) by 454 sequencing libraries (HTS) and CARD-FISH. (B) Scatterplot of differences between relative abundances of studied bacterial groups estimated by CARD-FISH and HTS against the average of the two values. (C) Scatterplot of ranked relative abundances of studied bacterial groups by HTS and CARD-FISH. (D) Scatterplot of differences between ranked relative abundances of studied bacterial groups estimated by CARD-FISH and HTS against the average of the two values. Black lines in panels A and C show a 1:1 relationship. Solid black lines in panels B and D show average differences for the whole data set, solid gray lines show 1 standard deviation, and dashed gray lines show 2 standard deviations. Different bacterial groups are color coded, and lakes of sample collection are indicated by shape. Individual plots for panels A and C are shown in Fig. S6 and S7, respectively.

