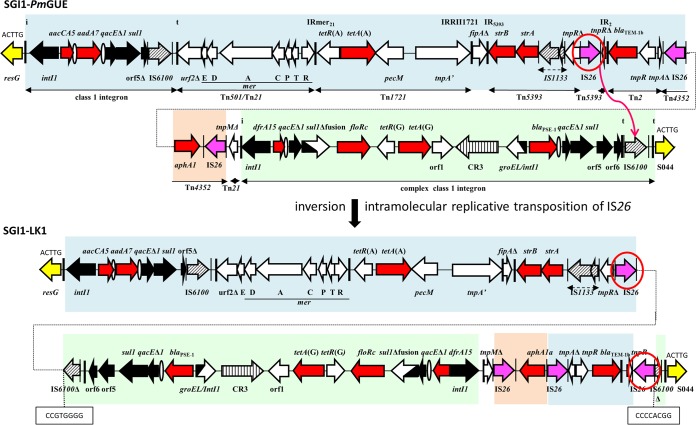
FIG 2.
The MAR region of SGI1-PmGUE and generation of the MAR region of SGI1-LK1. Horizontal arrows indicate genes and open reading frames (ORFs) with their transcriptional orientation. The segments with genes and ORFs present in SGI1-K are in blue, those present in SGI1-L are in green, and those corresponding to IS26-aphA1 are in orange. Backbone genes are represented in yellow. Black arrows represent 5′ conserved segments and 3′ conserved segments of integrons. The thick vertical bars indicate the inverted repeats (IRs) of integrons (IRi) and transposons (IRt). Resistance genes are shown with red arrows, and ovals represent attC sites. The insertion sequences (ISs) are represented by hatched arrows and by purple arrows for IS26. The IS26s predicted to cause rearrangements are circled. Their IRs are represented by thin vertical bars.

