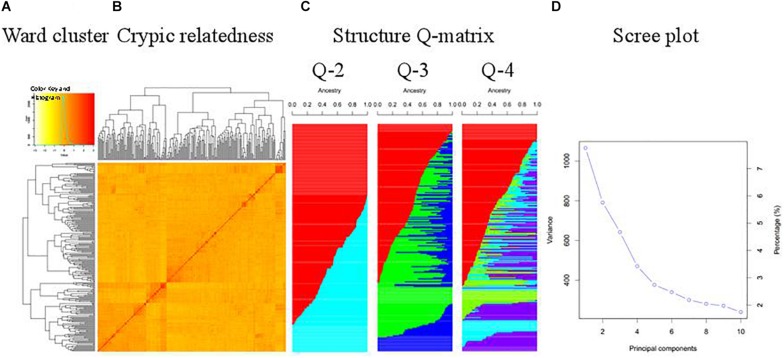
FIGURE 1.
Structure analysis of the WAPS population. (A) Ward clustering of the population; (B) Cryptic relatedness matrix based on genetic distance; (C) Matrices of membership coefficients corresponding to 2 to 4 hypothetical subpopulations; (D) Scree plot generated by GAPIT demonstrating genetic variance explained by each principal component.

