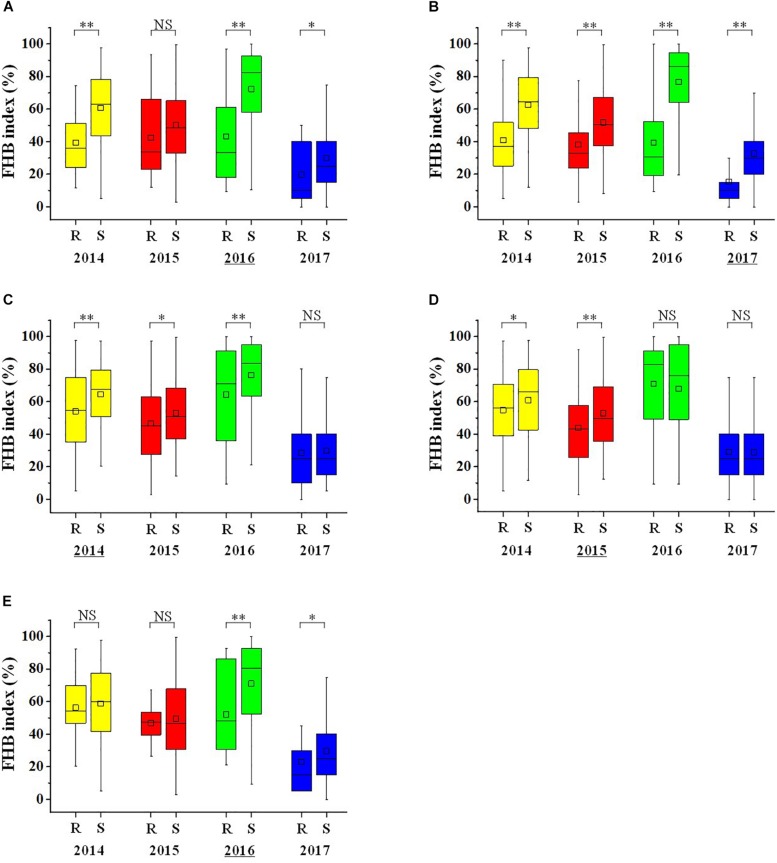
FIGURE 3.
Box plots visualizing differences in Fusarium head blight index between two groups of wheat accessions with contrasting resistance or susceptibility alleles for QTL on chromosomes 1AS (A), 2DL (B), 5AS (C), 5AL (D), and 7DS (E). The yellow, red, green and blue box plots represent 2014, 2015, 2016 and 2017, respectively. The horizontal line within boxes represent the median, and black squares indicate means. ‘∗∗’, ‘∗’ and “NS,” P < 0.01, P < 0.05 and non-significant. “R” and “S” represent lines with the resistance and susceptibility alleles, respectively. The year with the highest FHB index difference between R and S for each QTL was underlined in the X-axis.

