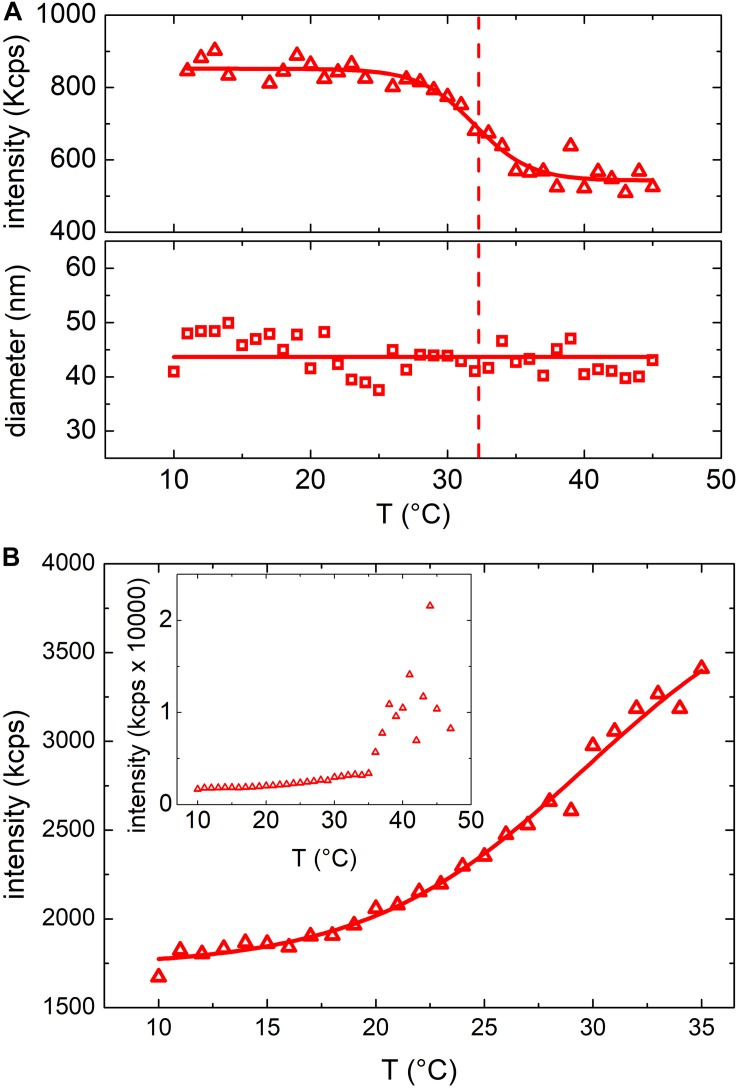
FIGURE 2.
(A) Mean scattering intensity (upper panel) and hydrodynamic diameter (lower panel) resulting from DLS measurements at increasing temperatures between 10°C and 45°C of vesicles grown at 37°C; solid lines results from Boltzmann fit and linear fit respectively while the dashed line highlights the transition temperature. (B) Mean scattering intensity of a DLS measurement at increasing temperatures between 10°C and 35°C of E. coli bacteria grown at 37°C. Inset shows the mean scattering intensity up to 45°C (above 35°C the bacteria start to grow).

