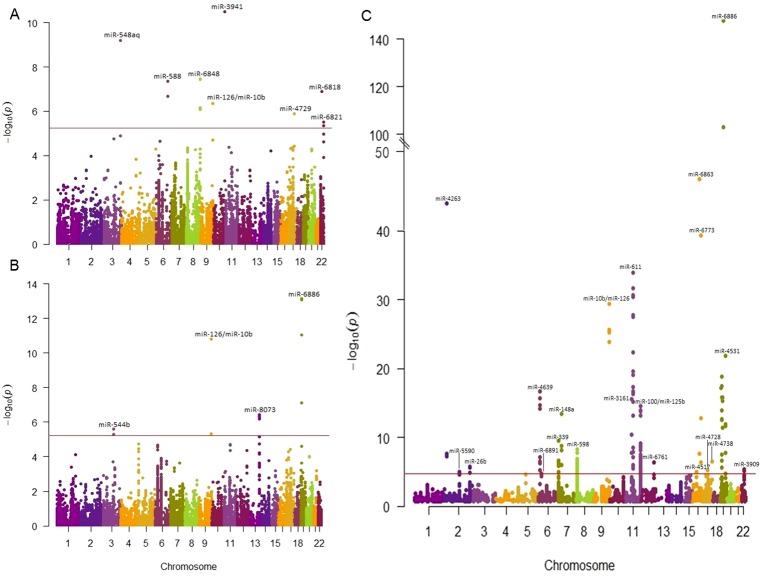
Figure 2.
Manhattan plots showing the association of miRNA-SNPs with T2D, CAD, and lipid traits. The association miRNA-related SNPs and cardiometabolic traits were examined using the publicly available GWAS data. We reported the most significantly associated miRNA of each SNP loci. The horizontal red line indicates the study significance threshold. (A) Manhattan plot showing the association of miRNA-SNPs with T2D in which 12 SNPs in 8 miRNAs passed the significant threshold. (B) Manhattan plot showing the association of miRNA-SNPs with CAD in which 13 SNPs in 9 miRNAs passed the significance threshold. (C) Manhattan plot showing the association of miRNA-SNPs with lipid traits in which 107 SNPs in 36 miRNAs passed the significant threshold. When SNPs were present in more traits, the most associated SNP was plotted.

