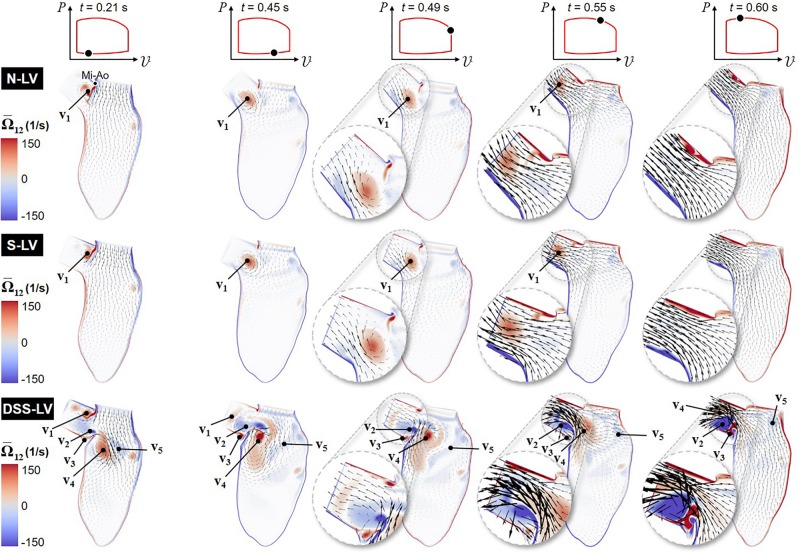
FIGURE 2.
Snapshots of the velocity vector and vorticity contour fields captured in the N-LV, S-LV, and DSS-LV models during early ventricular filling (0.21 s), late filling (0.45 s), early systole (0.49 s), acceleration phase (0.55 s), and at peak systole (0.60 s) (Mi-Ao, mitral inlet-aortic outlet junction).

