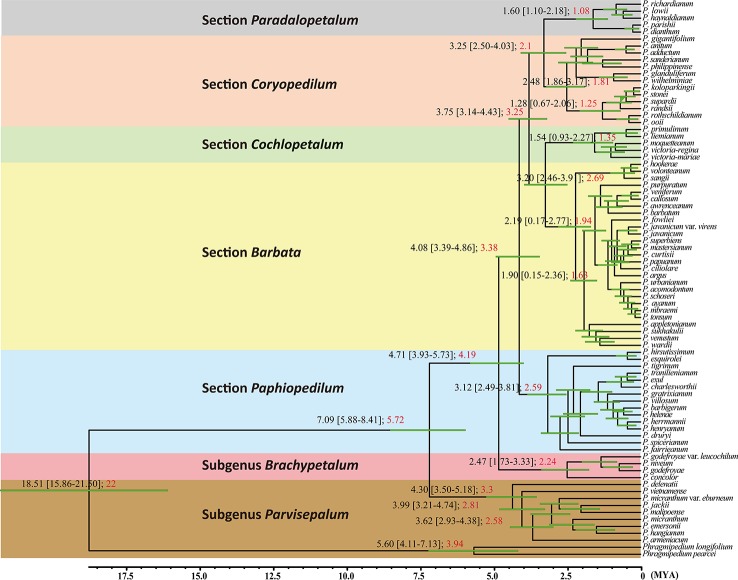
Figure 4.
Results of calescence time estimations performed with BEAST 1.8.0 for the from 78 Paphiopedilum taxa based on the combined data matrix (nuclear ribosomal ITS, plastid trnL intron, trnL-F spacer, and atpB-rbcL spacer). The black numbers in each node are using the mean rate of 1.82 × 10⁻⁹ subs/site/year, with the lower and upper limits 1.11 × 10⁻⁹ subs/site/year and 2.53 × 10⁻⁹ subs/site/year (Tsai et al., 2015). The red numbers in each node are using the Gustafsson et al. (2010) fossil calibration time data to calibrate the divergence time.

