Figure 2.
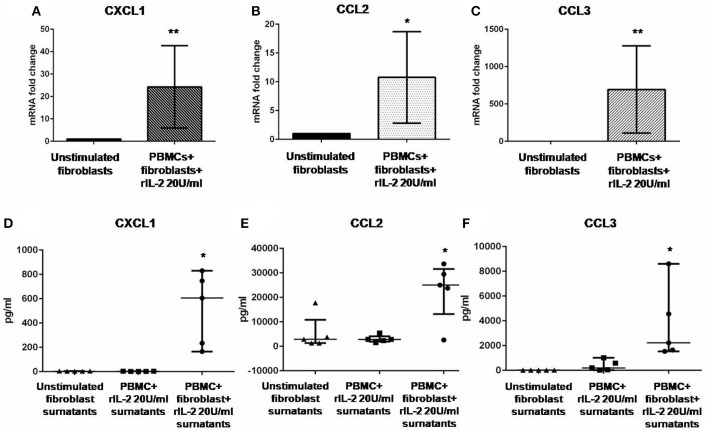
Levels of CXCL1, CCL2, and CCL3 in co-cultured fibroblasts and supernatants from early dcSSc patients. Results in panels (A–C) are fold changes in mRNA levels of IL17A target genes in real-time PCR. Results in panels (D–F) are concentrations expressed in pg/ml, in multiple suspension immunoassay. (A–C) Show the expression of CXCL1, CCL2, and CCL3 in fibroblasts co-cultured with autologous PBMCs and hrIL-2 20 U/ml as compared to control fibroblasts. (D–F) Show the concentrations of secreted CXCL1, CCL2, and CCL3 in supernatants from co-cocultures and hrIL-2 20 U/ml as compared to supernatants from control fibroblasts after adjusting by concentrations measured in PBMCs cultured with hrIL-2 20 U/ml only. Data are median and IQR ranges, Wilcoxon signed rank test. *p < 0.05; **p < 0.01; number of samples per group = 5.

