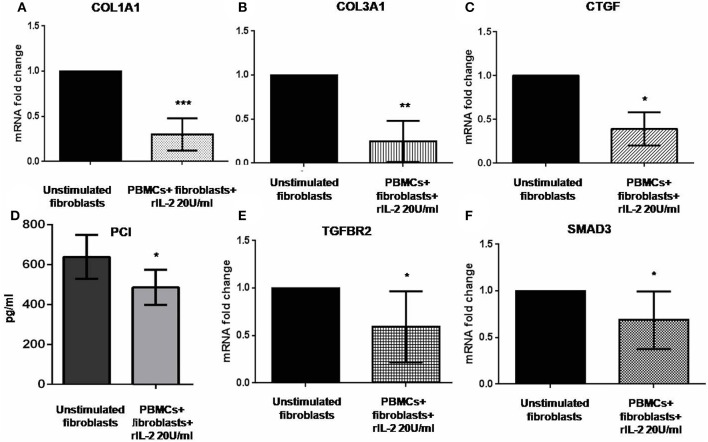
Figure 3.
Profibrotic gene levels in co-cultured fibroblasts from early dcSSc patients and PCI in co-culture supernatants. Results in panels (A–C) and (E,F) are fold changes in mRNA levels of the profibrotic genes COL1A1, COL3A1, and CTGF, and of the two key mediators of the TGF-β signaling TGFBR2 and SMAD3 in real-time PCR. All show the expression of the investigated genes in fibroblasts co-cultured with autologous PBMCs and hrIL-2 20 U/ml as compared to control fibroblasts. Data are median and IQR ranges, Wilcoxon signed rank test. Results in panel (D) are concentrations as expressed in pg/ml in sandwich ELISA. Data are mean ± SD, paired Student's t-test. *p < 0.05; **p < 0.01; ***p < 0.001; number of samples per group = 5.

