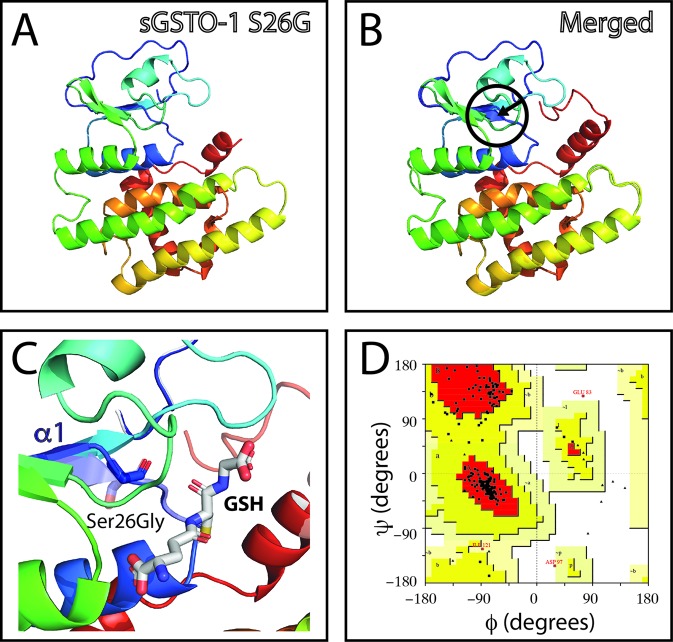
Figure 2.
Evaluation of single-nucleotide polymorphism (SNP) c.205A > G effect on the predicted S. salar GSTO-1 (sGSTO-1) structure by homology modeling. (A) Predicted tridimensional sGSTO-1 including the S26G substitution (sGSTO-1 S26G). (B) sGSTO-1 and sGSTO-1 S26P overlay. The punctual amino acid substitution (dotted arrow line) and the region of the secondary structure affected (β2 sheet, circle) are indicated. (C) Enlarged view of the sGSTO-1 S26P substitution shown in (B). sGSTO-1 (transparent) and sGSTO-1 (colored) are shown. The reduced glutathione (GSH) molecule is represented. (D) Ramachandran plot for the predicted sGSTO-1 S26G structure. The amino acid distribution into most favored regions (A,B,L), additional allowed regions (a,b,l,p), generously allowed regions (~a,~b,~l,~p), and disallowed regions (GLU83, ASP97) is indicated.

