Figure 6.

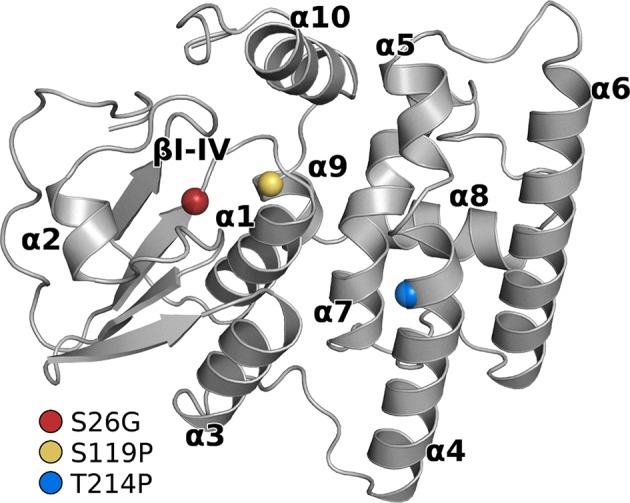
Structure of the GSTO-1 homology model with labeled secondary structure elements. Colored spheres show the position of each punctual variant: red (S26G), yellow (S119P), blue (T214P).

Structure of the GSTO-1 homology model with labeled secondary structure elements. Colored spheres show the position of each punctual variant: red (S26G), yellow (S119P), blue (T214P).