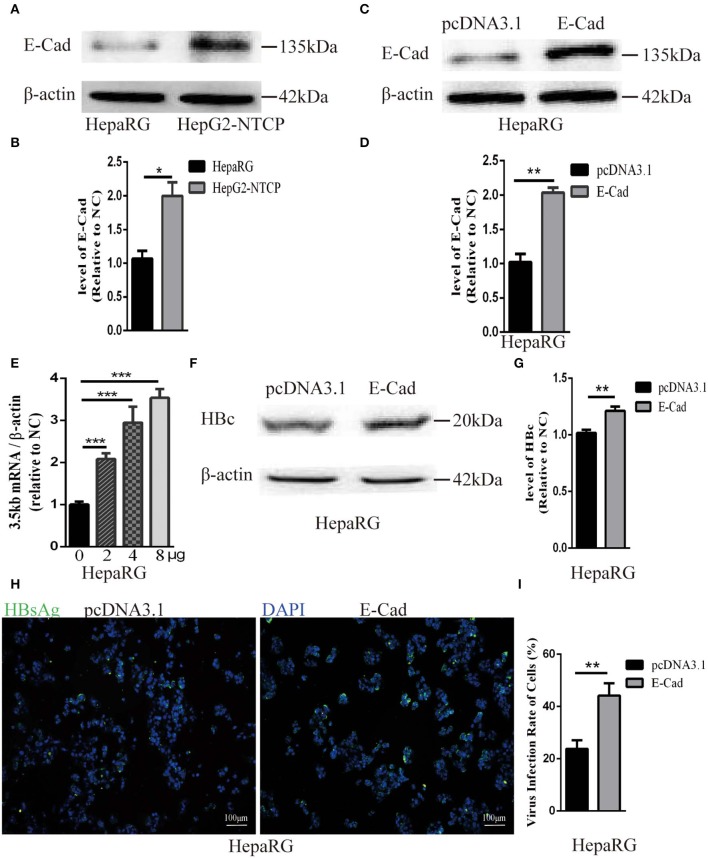
Figure 3.
Overexpression of E-cadherin promotes HBV particles infection in HepaRG cells. (A) E-cadherin expression was assessed via western blot analysis in HepaRG and HepG2-NTCP cells. (B) The densitometric ratios were normalized to the β-actin and then compared to the controls. (C) Four microgram of pcDNA3.1-E-cadherin was transfected into HepaRG cells planted in 6-well plate. E-cadherin expression was assessed via western blot analysis 3 days post-transfection. (D) The densitometric ratios were normalized to the β-actin and then compared to the controls. (E) 0, 2, 4, and 8μg of pcDNA3.1-E-cadherin was transfected into HepaRG cells planted in 6-well plate. Then the cells were planted into 24-well plate at 2 days after transfection and then infected with HBV virus. Total RNA was extracted 2 days post-infection and the amount of HBV was assessed via qRT-PCR quantification of HBV 3.5 kb mRNA normalized to β-actin mRNA. (F–I) Four microgram of pcDNA3.1-E-cadherin was transfected into HepaRG cells planted in 6-well plate. Then the cells were planted into 24-well plate at 2 days after transfection and then infected with HBV virus. (F) Total protein was extracted 3 days post-infection and HBV core (HBc) expression was assessed by western blot analysis in HepaRG cells. (G) The densitometric ratios were normalized to the β-actin and then compared to the controls. (H) HBsAg expression was assessed by immunofluorescence 3 days post-infection in HepaRG cells. (I) The virus infection rate of the cells is the percentage of cells expressing green fluorescence calculated by the ImageJ-win 64. Representative data is shown from triplicate experiments. E-Cad, E-cadherin. *p < 0.05; **p < 0.01; ***p < 0.001; error bars: standard deviation (SD).

